. 2014 Dec 17;84(6):1226-39.
doi: 10.1016/j.neuron.2014.12.014.

Mutations in KATNB1 cause complex cerebral malformations by disrupting asymmetrically dividing neural progenitors

Affiliations

Mutations in KATNB1 cause complex cerebral malformations by disrupting asymmetrically dividing neural progenitors

Ketu Mishra-Gorur et al. Neuron. .

Erratum in

  • Neuron. 2015 Jan 7;85(1):228
  • Mutations in KATNB1 Cause Complex Cerebral Malformations by Disrupting Asymmetrically Dividing Neural Progenitors.
    Mishra-Gorur K, Çağlayan AO, Schaffer AE, Chabu C, Henegariu O, Vonhoff F, Akgümüş GT, Nishimura S, Han W, Tu S, Baran B, Gümüş H, Dilber C, Zaki MS, Hossni HAA, Rivière JB, Kayserili H, Spencer EG, Rosti RÖ, Schroth J, Per H, Çağlar C, Çağlar Ç, Dölen D, Baranoski JF, Kumandaş S, Minja FJ, Erson-Omay EZ, Mane SM, Lifton RP, Xu T, Keshishian H, Dobyns WB, Chi NC, Šestan N, Louvi A, Bilgüvar K, Yasuno K, Gleeson JG, Günel M. Mishra-Gorur K, et al. Neuron. 2015 Jan 7;85(1):228. doi: 10.1016/j.neuron.2014.12.046. Epub 2015 Jan 7. Neuron. 2015. PMID: 29654772 No abstract available.

Abstract

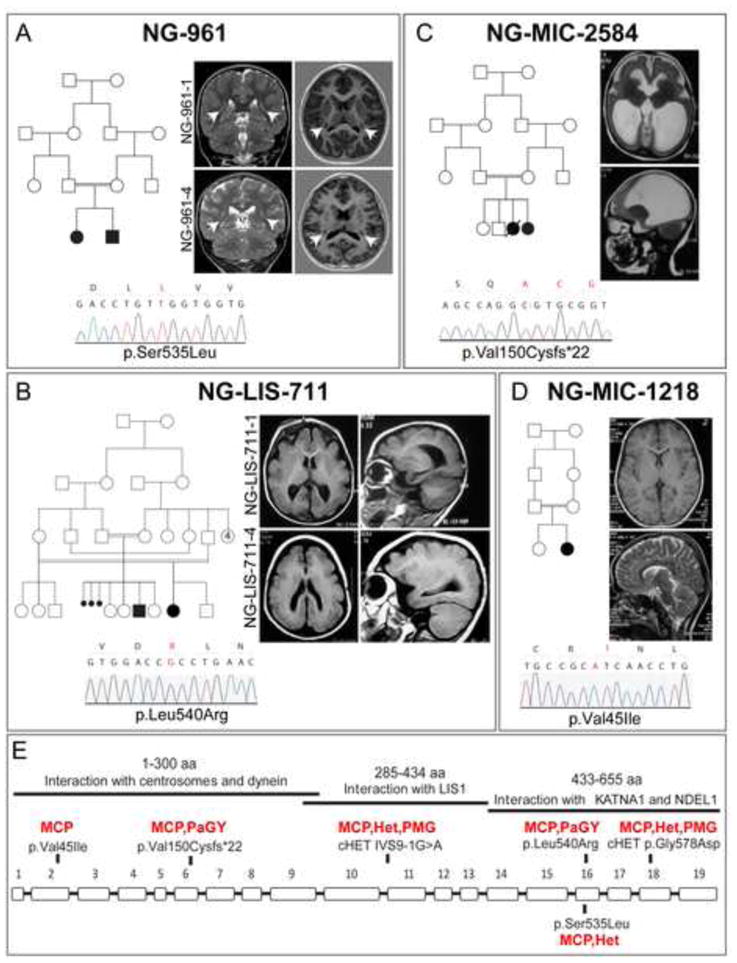
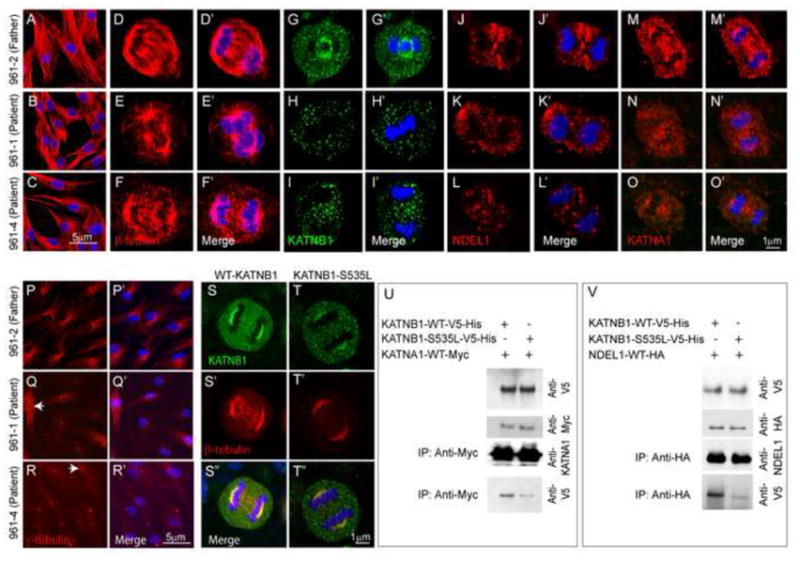
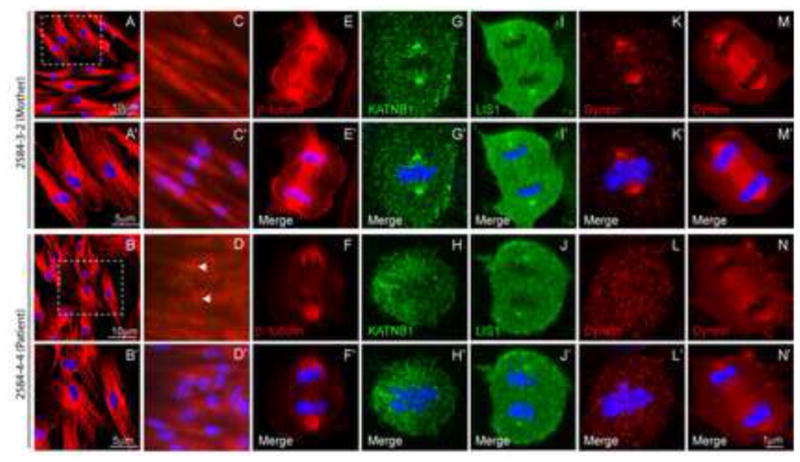
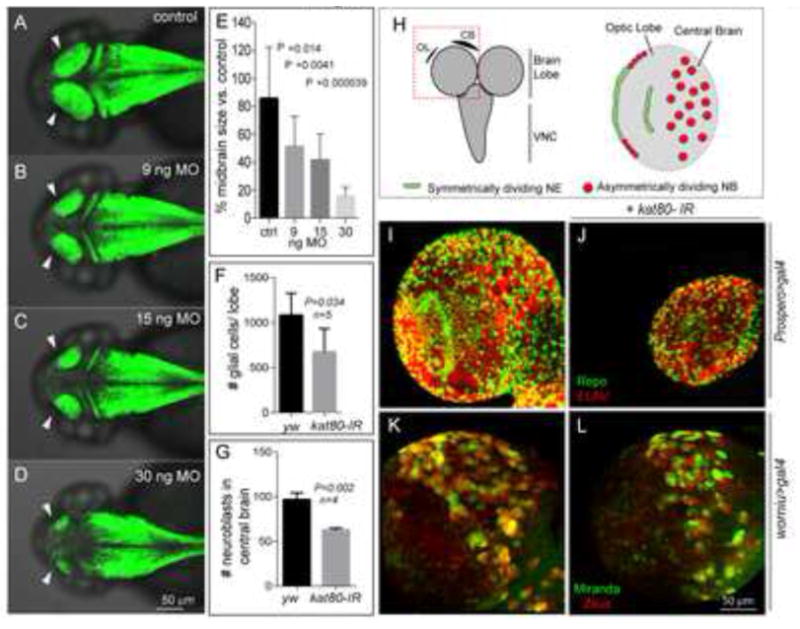
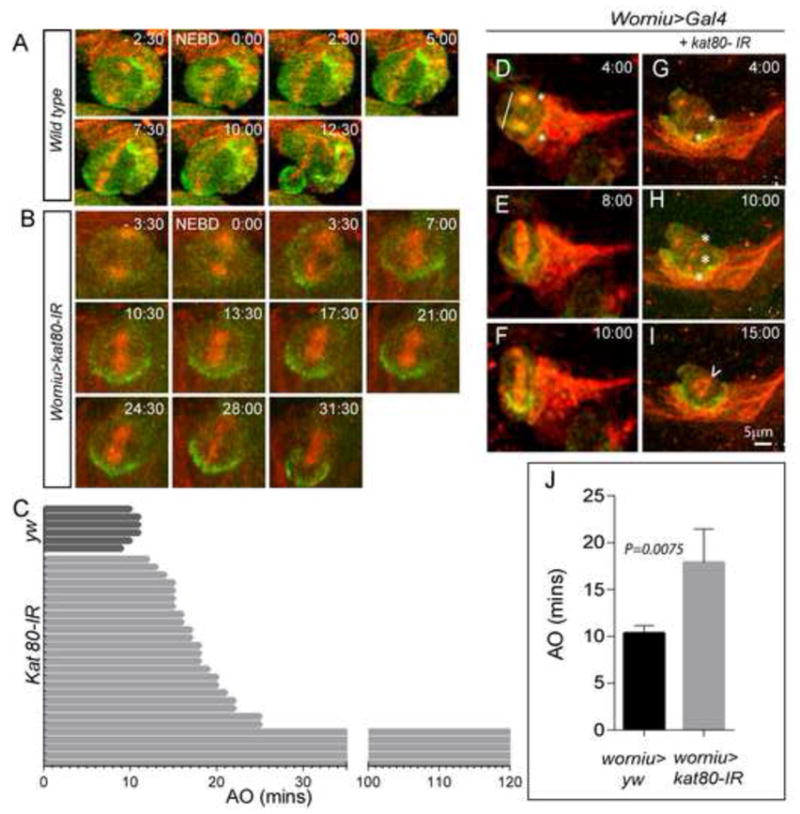
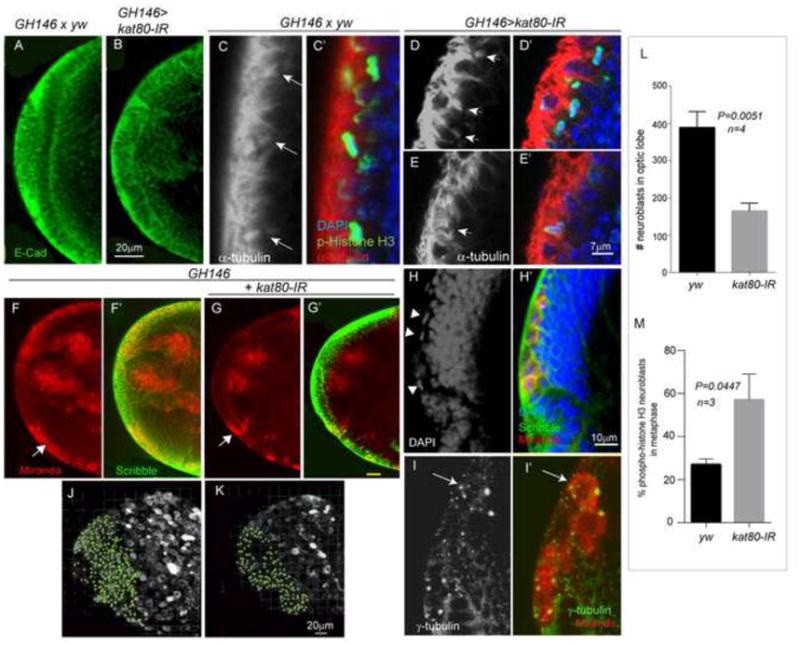
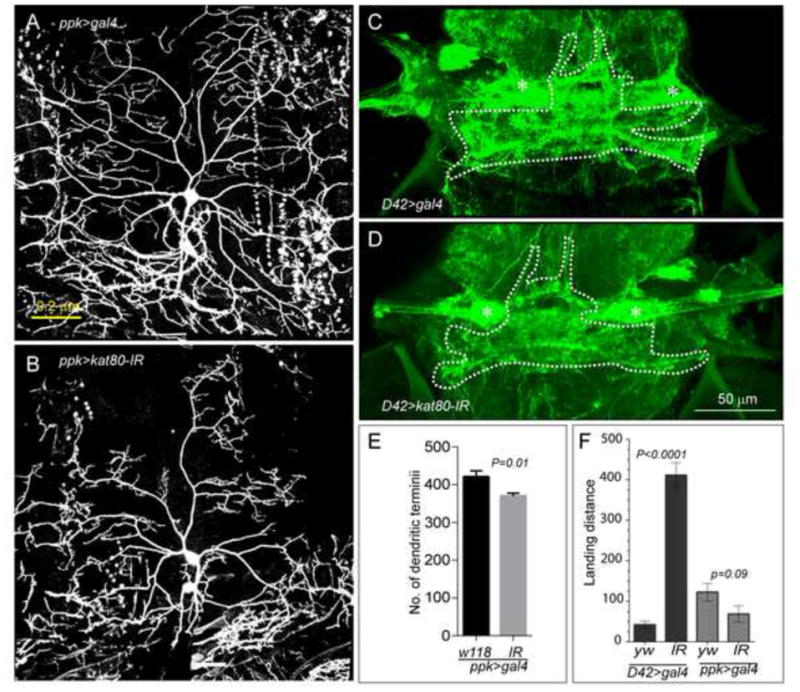
Exome sequencing analysis of over 2,000 children with complex malformations of cortical development identified five independent (four homozygous and one compound heterozygous) deleterious mutations in KATNB1, encoding the regulatory subunit of the microtubule-severing enzyme Katanin. Mitotic spindle formation is defective in patient-derived fibroblasts, a consequence of disrupted interactions of mutant KATNB1 with KATNA1, the catalytic subunit of Katanin, and other microtubule-associated proteins. Loss of KATNB1 orthologs in zebrafish (katnb1) and flies (kat80) results in microcephaly, recapitulating the human phenotype. In the developing Drosophila optic lobe, kat80 loss specifically affects the asymmetrically dividing neuroblasts, which display supernumerary centrosomes and spindle abnormalities during mitosis, leading to cell cycle progression delays and reduced cell numbers. Furthermore, kat80 depletion results in dendritic arborization defects in sensory and motor neurons, affecting neural architecture. Taken together, we provide insight into the mechanisms by which KATNB1 mutations cause human cerebral cortical malformations, demonstrating its fundamental role during brain development.


Figures

Figure 1
Figure 1. KATNB1 mutations in MCD patients
(A) Kindred NG-961. Pedigree structure depicting a 1st cousin consanguineous union is shown on the left. Coronal T2-weighted images (left) and axial T1-weighted images (right) show symmetric nodular grey matter heterotopia in the bilateral corona radiata, indicated with white arrows, in both affected siblings. Sanger sequencing confirmation of the p.Ser535Leu mutation in KATNB1 is shown at the bottom. (B) Kindred NG-LIS-711. Complex pedigree structure is shown at left. Axial (left) and sagittal (right) T1-weighted images show diffuse pachygyria. A chromatogram of Sanger sequencing result, which confirmed the KATNB1 p.Leu540Arg homozygous mutation in both affected children, is shown at the bottom. (C) Kindred NG-MIC-2584. Pedigree structure demonstrating a 1st cousin consanguineous union with two affected children (one deceased) is shown on the left. Axial (upper) and sagittal (lower) T2 -weighted images reveal a microlissencephalic brain with grossly dilated ventricles. Sanger sequencing confirmation of the p.Val150Cysfs*22 homozygous mutation is shown at the bottom. (D) Kindred NG-MIC-1218. Pedigree structure (top left) and axial T1- (upper) and sagittal T2- (lower) weighted images revealing a microcephalic brain with grossly normal architecture. The patient is homozygous for the p.Val45Ile mutation (bottom). (E) Exon-intron structure of KATNB1 is shown. Solid bars on top indicate the functional interaction domains and their localization to the KATNB1 protein. The location of each mutation and the associated phenotype are noted. MCP: microcephaly; Het: heterotopia; PaGY: pachygyria; PMG: polymicrogyria. (See also Figure S1 and Table S1).
Figure 2
Figure 2. C-terminal mutant forms of KATNB1 disrupt the mitotic spindle and display reduced interaction with NDEL1 and KATNA1
(A–C) As evidenced by beta-tubulin staining, microtubule architecture of the interphase dermal fibroblasts, derived from patients and their parents, is intact. However, the mitotic spindle is significantly disrupted and malformed in patient-derived cells in anaphase (D–F). Patient fibroblasts also show reduced localization of KATNB1 (G–I), NDEL1 (J–L) and KATNA1 (M–O) to the mitotic spindle and increased number of centrosomes (arrow) as seen by staining for γ-tubulin (P–R). Panels marked with a prime (′) show merged images of primary antigen and DAPI (blue) staining (D–F, G–I, J–L, M–O, P–R′). Consistent with the observations in patient fibroblasts, transfection of HeLa cells with wild type and mutant forms of KATNB1 results in reduced localization of mutant form of KATNB1 (green) to centrosomes and abnormal spindle formation (tubulin staining, red) in anaphase cells (S–T). The specific KATNB1 mutation assayed/investigated is indicated at the top of the panel. Co-immunoprecipitation of wild type and mutant forms of KATNB1 with KATNA1 (U) and NDEL1 (V) shows reduced interaction of mutant KATNB1 with both proteins. Scale bar: 5 μm (A–C, P–R) 1μm (D–O, S–T). All confocal images were captured using identical settings. (See also Figure S2)
Figure 3
Figure 3. N-terminal mutant forms of KATNB1 display reduced interaction with dynein and disrupted mitotic spindle
β-tubulin staining shows microtubule architecture to be intact in interphase dermal fibroblasts derived from patients and their parents (A–B). However, patient-derived cells display increased number of centrosomes (arrow) as seen by staining for γ-tubulin (C–D) and significantly disrupted and malformed mitotic spindle in anaphase (E–F). Patient fibroblasts also show reduced localization of KATNB1 (G–H), LIS1 (I–J) and dynein (K–N) to the mitotic spindle and spindle poles. Panels marked with a prime (′) show merged images of primary antibody and DAPI (blue) staining (A–N′). All confocal images were captured using identical settings.
Figure 4
Figure 4. KATNB1 is highly expressed in the developing brain
(A) KATNB1 is expressed across all regions and developmental periods in the human brain. KATNB1 exon array signal intensity. NCX, neocortex; STR, striatum; HIP, hippocampus; MD, mediodorsal nucleus of the thalamus; AMY, amygdala; CBC, cerebellar cortex. In developing mouse brain, Katnb1 is expressed in neural progenitors until mid-neurogenesis (E11.5, E13.5) (B, C), and then is also expressed in postmitotic neurons in the cortical plate (E15.5, E18.5) (D, E), and widespread expression was observed in postnatal brain (P14) (F). ne: neuropithelium; vz: ventricular zone; svz: subventricular zone; iz: intermediate zone; cp: cortical plate. Scale bar: GI: 200 μm, JK: 500 μm. Similarly, katnb1 is expressed in the brain in the developing zebrafish embryo (G–K): Lateral views of whole-mount in situ hybridization of the brain and torso of zebrafish embryos reveal the expression pattern of katnb1 at 24 hours post fertilization (hpf) (G), 36 hpf (H), 48 hpf (I), 60 hpf (J) and 72 hpf (K). During early developmental stages (G–H), katnb1 mRNA expression is ubiquitous throughout the embryo, including the cephalic region. As the embryos develop further (I–K), katnb1 mRNA expression becomes restricted to neural tissue. Black lines point to various anatomical structures. d, diencephalon; t, telencephalon; m, mesencephalon; rh, rhombomeres; cb, cerebellum; ot, optic tectum; mhb, midbrain hindbrain boundary; mb, midbrain; hb, hindbrain; fb, fin bud. Scale bar: 500 μm.
Figure 5
Figure 5. Knockdown of KATNB1 orthologs in zebrafish and Drosophila results in small brain phenotype
katnb1 morpholino reduces zebrafish midbrain size: Confocal microscopy shows that the katnb1 morphants at (B) 9 nanogram (ng), (C) 15 ng, and (D) 30 ng have smaller midbrains (arrows) as compared with (A) control at 2 days post fertilization (dpf). The reduction in brain size is statistically significant (E). Zebrafish brain is labeled with green fluorescence by Tg(HuC:Kaede). (H) Left panel: Schematic of the Drosophila brain; box indicates brain lobe imaged. Right panel: Schematic of a single brain lobe marks the location of symmetrically dividing neuroepithelium (NE, green) and asymmetrically dividing neuroblasts (NBs, red). (I, J) Expression of kat80-IR with prospero-Gal4 results in a dramatically reduced brain size in 3rd instar larvae. There is an overall reduction in the number of neurons and glia generated as seen by ELAV (red) and Repo (green) staining, respectively. (K, L) kat80-IR expressed under worniu-Gal4, UAS-mir::GFP, UAS-zeus::mCherry results in a significant reduction in NB number in central brain. Images in FI are 3D projection of identical Z-sections. (F) Quantification of glial cell counts seen in panel FG. There is significantly reduced number of glial cells in kat80-IR larvae (Error bars indicate SD, yw: 1080±110; kat80-IR: 673±116; two-tailed test, P=0.034). (G) GFP- and RFP-positive cells were quantified using 3D projections of identical Z-stacks from worniu>gal4 and worniu>kat80-IR brains, which reveal a significant reduction in central brain NBs per brain lobe (yw: 96.5±7.9; kat80-IR: 62.5±2.3; P = 0.002). (See also Figure S3)
Figure 6
Figure 6. kat80-IR delays anaphase onset in Drosophila central brain neuroblasts, causing a reduction in their numbers
(A–C) kat80-IR was expressed under worniu-Gal4, UAS-mir::GFP, UAS-zeus::mCherry. Thirty NBs from worniu>kat80-IR and 6 NBs from worniu>gal4 3rd instar larval brains were used for time- lapse imaging. Wild type NBs exhibit anaphase onset at ~ 10.33 ± 0.82 minutes after nuclear envelope breakdown. kat80-IR leads to increase in anaphase onset time with an average of about 17.9 ± 3.59 minutes (error bars indicate standard deviation; two-tailed test, P=0.008). In addition, 4 NBs failed to display anaphase onset even after 2 hours of imaging (C). Snapshots of live imaging of 3rd instar larval brains expressing kat80-IR under worniu>Gal4, mir-GFP, zeus-mcherry. A wild type (D–F) and a kat80-IR (G–I) NB undergoing division are shown. kat80-IR expression results in multiple centrosomes (asterisks in G–H), and multipolar and barrel-shaped spindles (arrowhead in I). (J) Quantification of time to anaphase onset of 30 kat80-IR NBs compared with wild type (yw) cells reveals significant delay in mutant NBs.
Figure 7
Figure 7. kat80-IR results in centrosomal defects and reduced neuroblasts in Drosophila optic lobe
Expression of kat80-IR with GH146-gal4 does not affect the morphology of the neuroepithelium (NE, marked by E-cadherin staining (green) in A, B) or spindle orientation (C–E′). In C–E′, arrows mark the mitotic spindles and staining with alpha tubulin (red), phospho-histone H3 (pH3, marking the metaphase plate in the neuroepithelial cells, green) and DAPI (marking the nuclei, blue) are shown. Panels C, D, E show α-tubulin staining only (gray scale) for easier visualization of the mitotic spindle. (FG) Expression of kat80-IR in the optic lobe results in significantly reduced number of NBs (arrow). Miranda (marking NBs, red) and Scribble (marking NE cells) staining is shown in wild-type (yw, F-F′) versus kat80-IR (G-G′) larval brains. H and H′ are high magnification images of the kat80-IR brain in G, indicating that the NBs in kat80-IR brains are mainly in metaphase (arrowheads). (I-I′) GH146>kat80-IR brains also show increased number of centrosomes in NBs as seen by gamma-tubulin staining (green) in miranda-positive NBs (red). (JK) 3D projections of identical Z-sections of GH146>kat80-IR and wildtype (yw) brains showing reduced number of miranda positive NBs in the optic lobe of 3rd instar larval brains. (L) Quantification of the miranda positive cells in the optic lobe shows significantly reduced NBs in the kat80-IR brains (yw: 389±24.8; kat80-IR:165 ±10.5; two-tailed t-test P = 0.005). (M) Quantification of phosphor-histone H3 (pH3) positive NBs in kat80 depleted brains shows an increase in the number of pH3 positive NBs in metaphase (also visible in panel H) (yw: 26.9±1.5; kat80-IR: 57±7; two-tailed t-test, P =0.04) suggesting delayed anaphase onset. (See also Figure S4)
Figure 8
Figure 8. kat80-IR results in reduced dendritic arborization in central and peripheral nervous system
(CNS and PNS, respectively) (A–B) Larval class IV sensory neurons in the PNS were visualized using UAS>CD8-GFP expressed under the control of the PPK-GAL4 driver. Morphological analysis of dendrites of class IV dendrites, which display distinct morphology, was only performed in segments A3 and A4. We observed a significant reduction in dendrite extension in kat80-IR larvae (B) as compared to the wild-type, shown in A. (C–D) kat80-IR reduced dendritic arbor of motoneuron 5 in the CNS (D) as compared to wild-type flies (C). Dendrites of adult flight motoneurons in the CNS were visualized by expressing UAS>CD8-GFP under the control of the D42-GAL4 or C380-GAL4 driver. Asterisk marks the motoneuron 5 cell body. (E) The total number of terminal dendrites is statistically significantly reduced in kat80-IR versus wild-type larvae as counted manually on z-projections: (mean± SEM: WT = 420 ± 15.67; kat80-IR = 369.6 ± 7.8, P = 0.01 (N= 10 cells, 7 larvae for WT and N= 10 cells, 5 larvae for kat80-IR larvae)). (F) The effect of reduced dendritic arborization of flight motoneurons was assessed in a flight assay. Expression of kat80-IR using the D42 driver (expressed in adult motoneurons controlling wing muscles) resulted in severely impaired flight response, as assessed by the landing distance in the cylinder (left 2 columns in black, landing distance in millimeters: mean ± SEM: D42 driver: WT (yw)= 42.4 ± 8.7; kat80-IR = 411.7 ± 30.7 (P=0.0001)). In contrast, kat80-IR expression in PNS sensory neurons under the ppk driver did not affect the flight response, as expected (right 2 columns in grey, landing distance in millimeters ppk driver: mean ± SEM: WT = 122.6 ± 21.8; kat80-IR = 69 ± 19.9). N= 20 adult males for each genotype. (See also Figure S5)

References

    1. Abdollahi MR, Morrison E, Sirey T, Molnar Z, Hayward BE, Carr IM, Springell K, Woods CG, Ahmed M, Hattingh L, et al. Mutation of the variant alpha-tubulin TUBA8 results in polymicrogyria with optic nerve hypoplasia. American journal of human genetics. 2009;85:737–744. - PMC - PubMed
    1. Ahmad FJ, Yu W, McNally FJ, Baas PW. An essential role for katanin in severing microtubules in the neuron. The Journal of cell biology. 1999;145:305–315. - PMC - PubMed
    1. Alkuraya FS, Cai X, Emery C, Mochida GH, Al-Dosari MS, Felie JM, Hill RS, Barry BJ, Partlow JN, Gascon GG, et al. Human mutations in NDE1 cause extreme microcephaly with lissencephaly [corrected] American journal of human genetics. 2011;88:536–547. - PMC - PubMed
    1. Armstrong DD. Neuropathology of Rett syndrome. Journal of child neurology. 2005;20:747–753. - PubMed
    1. Ashraf SI, Ganguly A, Roote J, Ip YT. Worniu, a Snail family zinc-finger protein, is required for brain development in Drosophila. Developmental dynamics: an official publication of the American Association of Anatomists. 2004;231:379–386. - PubMed

Publication types

MeSH terms