. 2014 Dec 17;84(6):1240-57.
doi: 10.1016/j.neuron.2014.12.017.

Katanin p80 regulates human cortical development by limiting centriole and cilia number

Affiliations

Katanin p80 regulates human cortical development by limiting centriole and cilia number

Wen F Hu et al. Neuron. .

Abstract

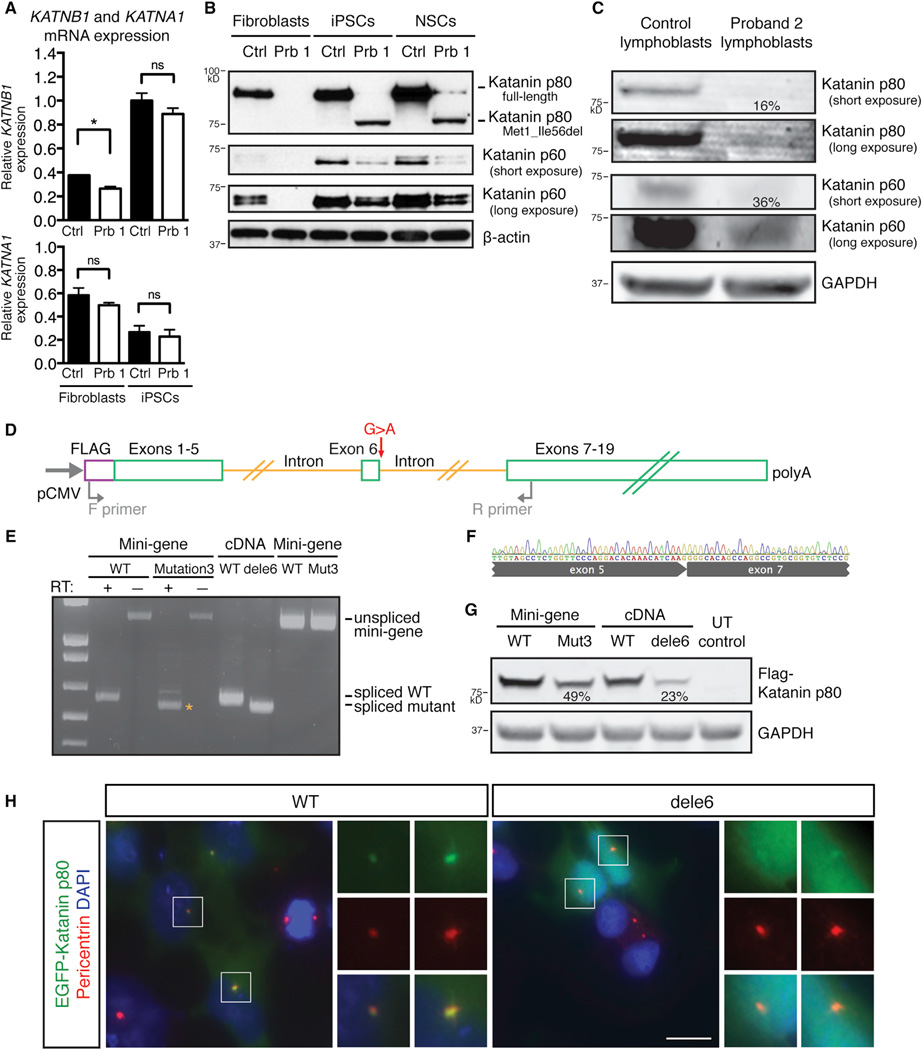
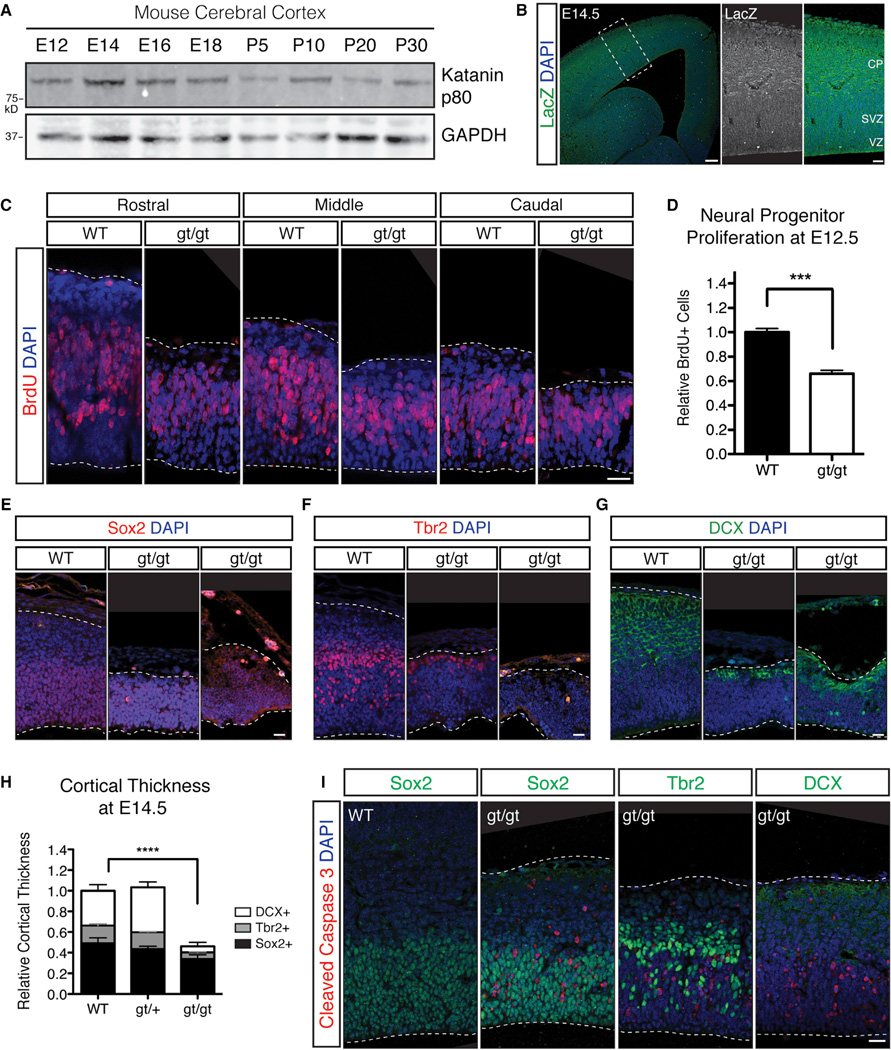
Katanin is a microtubule-severing complex whose catalytic activities are well characterized, but whose in vivo functions are incompletely understood. Human mutations in KATNB1, which encodes the noncatalytic regulatory p80 subunit of katanin, cause severe microlissencephaly. Loss of Katnb1 in mice confirms essential roles in neurogenesis and cell survival, while loss of zebrafish katnb1 reveals specific roles for katnin p80 in early and late developmental stages. Surprisingly, Katnb1 null mutant mouse embryos display hallmarks of aberrant Sonic hedgehog signaling, including holoprosencephaly. KATNB1-deficient human cells show defective proliferation and spindle structure, while Katnb1 null fibroblasts also demonstrate a remarkable excess of centrioles, with supernumerary cilia but deficient Hedgehog signaling. Our results reveal unexpected functions for KATNB1 in regulating overall centriole, mother centriole, and cilia number, and as an essential gene for normal Hedgehog signaling during neocortical development.


Figures

Figure 1
Figure 1. Mutations in KATNB1 Cause Microlissencephaly
(A) MRI images of affected individuals show reduced cortical size (ctx), simplification of gyral folding pattern, enlarged lateral ventricles (lv) posteriorly and thinning of the corpus callosum (cc), with relative sparing of the cerebellum (cb), basal ganglia (bg), thalamus (th), and brainstem (br). Scale bar, 50 mm. (B–B″) Pedigrees of families with microlissencephaly. Square, male; circle, female; red arrowhead, affected proband; black shading, affected individual; gray shading, reported affected individual, medical records unavailable; double lines, consanguineous marriages; diagonal line, deceased; asterisk, DNA sample collected. (C–C″) Mutation in Family 1 abolishes start ATG codon. Mutation in Family 3 is at a 5’ splice site. Missense mutation in Family 2 converts a conserved glycine to a tryptophan. (D) Predicted protein structure of katanin p80. Mutations lie at first amino acid and in WD40 domains. See also Figure S1, Table S1, and Movie S1.
Figure 2
Figure 2. Mutant KATNB1 Alleles Produce Less Protein Than Wild-Type Alleles, and dele6 Mutant Protein Is Mislocalized
(A) qRT-PCR of Proband 1-derived fibroblast and iPSC lines shows presence of KATNB1 and KATNA1 mRNA at levels comparable to control cell lines. Unpaired t test, p < 0.05; ns, not statistically significant. (B) Western blot of Proband 1-derived fibroblast and iPSC lines shows absence of full-length katanin p80 and presence of smaller protein product compared to control (top). Katanin p60 levels are also reduced (bottom). (C) Western blot of Proband 2-derived lymphoblastoid cell lines shows near absence of katanin p80, detectable only at high exposure (top), and reduction of katanin p60 (bottom). Quantification using LI-COR imaging system. (D) Schematic of the splice site minigene cDNA construct. Primer arrows show location of PCR primers for (E). (E) RT-PCR results of minigene assay. Smaller product in splice mutant minigene (asterisk) corresponds in size to deletion of exon 6 (dele6). (F) Sanger sequencing of smaller spliced product (asterisk in E) confirms skipping of exon 6. (G) Western blot of transfected minigenes and cDNAs shows reduced protein levels in splice mutant allele relative to wild-type. Quantification using the LI-COR imaging system. (H) Wild-type EGFP-tagged katanin p80 localizes to the centrosome (left; Pericentrin), but EGFP-tagged dele6 mutant protein diffuses throughout the nucleus, with minimal centrosomal localization (right). Scale bar, 10 um. See also Figure S2.
Figure 3
Figure 3. Katnb1 Gene-Trap Mutants Die by E14.5, with Brain Phenotypes Ranging from Microcephaly to Holoprosencephaly
(A) Location of gene-trap insertion. Gene-trap insertion leads to early truncation of Katnb1 mRNA, to mimic a null allele. (B and C) RT-PCR confirms absence of wild-type allele in homozygous gene-trap mice (B). Sanger sequencing of gene-trap RT-PCR product confirms splicing of exon 2 into gene-trap cassette (C). (D and E) Katanin p80 protein is absent in gt/gt mice (D), and less katanin p60 protein is produced in gt/gt mice, compared with wild-type (E). Quantification using the LI-COR imaging system. (F) Homozygous gt/gt mice are present in expected Mendelian ratios before E14.5 but are almost never found after E15.5, indicating that Katnb1 loss of function is embryonically lethal. Chi-square test, p < 0.0001. (G) Compared with wild-type, homozygous gt/gt embryos are dramatically reduced in body size at E14.5. Error bars indicate mean ± SEM. One-way ANOVA, p < 0.001. (H) Homozygous gt/gt embryos vary in size, with brain phenotypes ranging from microcephaly (embryos 2–4) to holoprosencephaly (embryo 5). Some homozygous gt/gt embryos are micropthalmic (embryo 2), while others have no eye development (embryos 3–5), and all have underdevelopment of the limb buds and pallor of the liver. All pictured embryos are littermates. Scale bar, 5 mm (top) and 1 mm (bottom). (I) Coronal sections through embryonic brains show reduced cortical size, thickness, and holoprosencephaly in homozygous gt/gt embryos. Dashed line, outline of brain. Scale bar, 200 um. (J) Distribution of homozygous gt/gt phenotypes recovered between E12.5 and E15.5.
Figure 4
Figure 4. Maternal Contribution of katnb1 Is Essential for Zebrafish Gastrulation
(A) Katanin p80 protein and gene structure is highly conserved between humans and zebrafish. (B) TALENs targeting the genomic region surrounding the zebrafish katnb1 exon 6-intron 6 boundary create a series of mutant alleles. Reference sequence (top). Blue box, TALEN recognition sites; dash, deleted base pairs; red letters, inserted base pairs. (C) Mutant alleles are predicted to alter protein structure by deletion of amino acids or early truncation of katanin p80 protein. (D) Progeny of mutant females show a wide spectrum of phenotypes, ranging from early embryonic lethality and anencephaly to microcephaly. (E) Maternal effect of katnb1 is observed in crosses of mutant females, compared with progeny arising from heterozygous carriers. Embryos developed normally until 70% epiboly. See also Table S2 and Figure S3.
Figure 5
Figure 5. Loss of Katanin p80 Impairs Proliferation of Cortical Progenitors at E12.5, with Fewer Progenitors and Postmitotic Neurons Present in Cortex
(A) Katanin p80 protein is present in the cerebral cortex throughout embryonic and postnatal development. (B) Katanin p80 protein is present throughout the developing cortex at high levels in postmitotic neurons in the cortical plate, and lower levels in progenitors of the ventricular and subventricular zones at E14.5. VZ, ventricular zone; SVZ, subventricular zone; CP, cortical plate. Scale bar, 50 um (left) and 20 um (inset, right). (C) Fewer actively proliferating cortical progenitors are labeled by acute BrdU injection at rostral (left), middle (middle), and caudal (right) matched coronal sections in gt/gt cortex compared with wild-type. Scale bar, 20 um. (D) Quantification of BrdU-positive cells per length of ventricular surface. Error bars indicate mean ± SEM. Unpaired t test, p < 0.001. (E–G) Homozygous gt/gt mutant cortex is reduced in thickness at E12.5 compared with wild-type, with preferential reduction in intermediate progenitors (F, Tbr2+) and neurons (G, DCX+) over radial glia (E, Sox2+). Scale bar, 20 um. (H) Quantification of radial thickness of cortex, with percent composition of markers in (E)–(G). Error bars indicate mean ± SEM. One-way ANOVA, p < 0.01. (I) Apoptotic cells labeled by activated cleaved caspase 3 are abundant in homozygous gt/gt ventricular zones, even in mildly affected embryos. Scale bar, 20 um. See also Figure S4.
Figure 6
Figure 6. Loss of Katanin p80 Causes Centrosome and Centriole Overduplication in Proband-Derived Cell Lines and MEFs
(A) Lymphoblasts derived from Proband 2 undergo centrosomal overduplication, with DNA surrounding centrally located centrosomes. Scale bar, 10 um. (B) Quantification of proportion of lymphoblasts with overduplicated centrosomes. Unpaired t test, p < 0.01. (C) Mitotic iPSCs derived from Proband 1 contain monoastral spindles, multipolar spindles, and lagging chromosomes (arrowhead). Scale bar, 10 um. (D) Quantification of proportion of mitotic iPSCs with abnormal mitoses. Unpaired t test, p < 0.0001. (E and F) A greater percentage of Proband 2-derived lymphoblasts are aneuploid and have skewed DNA content compared with control lymphoblasts by FACS (E), indicating that the cell cycle is disrupted in proband-derived lymphoblasts (F). See also Figure S5.
Figure 7
Figure 7. Loss of Katanin p80 Causes Centriole Overduplication
(A) Homozygous gt/gt MEFs have multipolar mitotic spindles and misaligned chromosomes (arrowhead). PHH3, phosphorylated histone H3. Scale bar, 10 um. (B) Centrioles, labeled by Centrin, are overduplicated in homozygous gt/gt MEFs compared with wild-type MEFs. Centrosomal proteins γ-tubulin (top), Stil (middle), and Cep63 (bottom) associate with supernumerary centrioles with normal stoichiometry. Scale bar, 10 um. (C) Serial transmission electron micrograph sections through centrosomes show multiple unpaired centrioles in gene-trap MEFs, whereas wild-type MEFs contain only one pair of centrioles. Arrowhead, centriole. Scale bar, 200 nm. (D) Quantification of mitotic spindle abnormalities in (A). Unpaired t test, p < 0.0001. (E) Quantification of centriolar overduplication in (B). Unpaired t test, p < 0.0001. (F) Homozygous gt/gt MEFs grow more slowly than wild-type or gt/+ MEFs. Two-way ANOVA, p < 0.001. See also Figure S6.
Figure 8
Figure 8. In the Absence of Katanin p80, Fibroblasts Produce Supernumerary Cilia with Abrogated Shh Signaling
(A) Homozygous gt/gt MEFs contain multiple mother centrioles that label with Ninein (top) and Cep164 (bottom). Scale bar, 10 um. (B) Homozygous gt/gt MEFs grow multiple cilia marked by IFT88 and Arl13b (right), while wild-type MEFs grow only a single cilium (left). Arrowheads, supernumerary cilia not shown in inset. Scale bar, 10 um. (C) After stimulation by Smoothened agonist (SAG), gt/gt MEFs fail to relocate Gli3 to the cilium, indicating a deficit in Sonic hedgehog signaling (right). Wild-type MEFs robustly relocate Gli3 to the cilium after SAG stimulation (left). Scale bar, 10 um. (E) Quantification of proportion of ciliated MEFs with supernumerary cilia from (B). Error bars represent mean ± SEM. Unpaired t test, p < 0.01. (E) Quantification of cilial tip Gli3 intensity in SAG-stimulated cells from (C). Unpaired t test, p < 0.0001. (F and G) Downstream Sonic hedgehog targets Gli1 (F) and Patched1 (G) are induced at lower levels following SAG stimulation in gt/gt MEFs compared with wild-type MEFs. Error bars represent mean ± SEM. Unpaired t test, p < 0.05. (H) NSCs derived from Proband 1 do not grow supernumerary cilia. Scale bar, 10 um. (I) After stimulation by Smoothened agonist (SAG), control and mutant NSCs show similar Smoothened (Smo) localization to the cilium. Scale bar, 10 um. See also Figure S7.

References

    1. Ahmad FJ, Yu W, McNally FJ, Baas PW. An essential role for katanin in severing microtubules in the neuron. J. Cell Biol. 1999;145:305–315. - PMC - PubMed
    1. Alkuraya FS, Cai X, Emery C, Mochida GH, Al-Dosari MS, Felie JM, Hill RS, Barry BJ, Partlow JN, Gascon GG, et al. Human mutations in NDE1 cause extreme microcephaly with lissencephaly [corrected] Am. J. Hum. Genet. 2011;88:536–547. - PMC - PubMed
    1. Anderson CT, Stearns T. Centriole age underlies asynchronous primary cilium growth in mammalian cells. Curr. Biol. 2009;19:1498–1502. - PMC - PubMed
    1. Arquint C, Nigg EA. STIL microcephaly mutations interfere with APC/C-mediated degradation and cause centriole amplification. Curr. Biol. 2014;24:351–360. - PubMed
    1. Ayoub AE, Oh S, Xie Y, Leng J, Cotney J, Dominguez MH, Noonan JP, Rakic P. Transcriptional programs in transient embryonic zones of the cerebral cortex defined by high-resolution mRNA sequencing. Proc. Natl. Acad. Sci. USA. 2011;108:14950–14955. - PMC - PubMed

Publication types

MeSH terms