. 2014 Dec 18;10(12):e1003966.
doi: 10.1371/journal.pcbi.1003966. eCollection 2014 Dec.

Evolution of integrated causal structures in animats exposed to environments of increasing complexity

Affiliations

Evolution of integrated causal structures in animats exposed to environments of increasing complexity

Larissa Albantakis et al. PLoS Comput Biol. .

Abstract

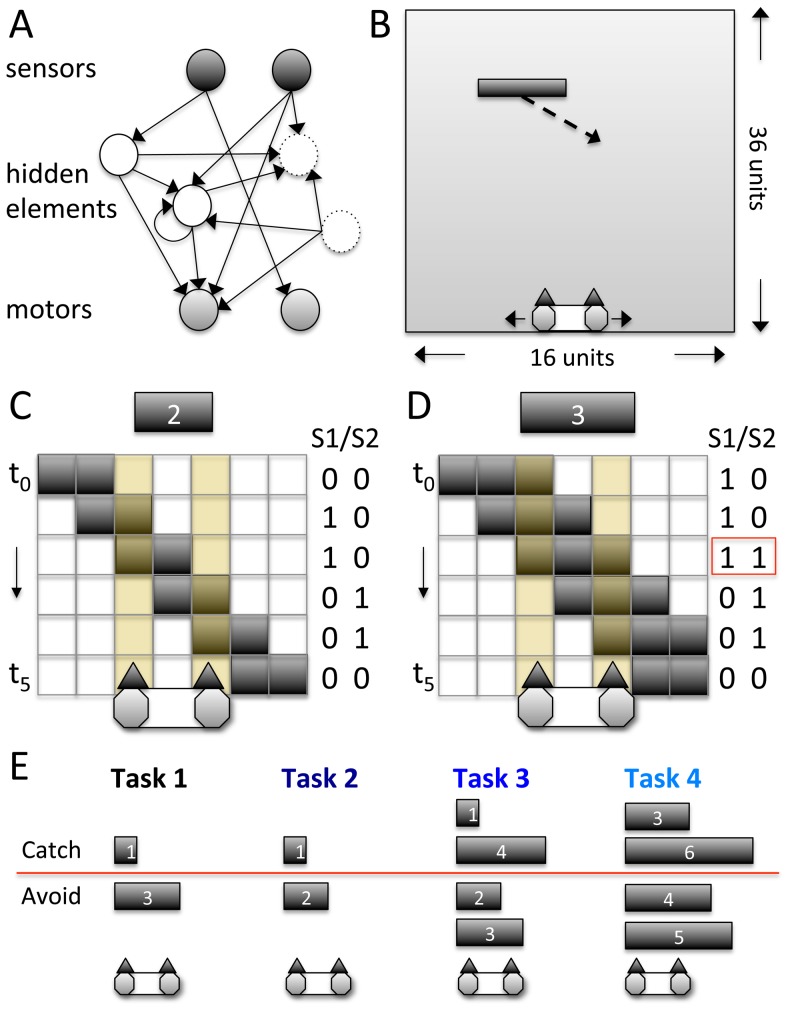
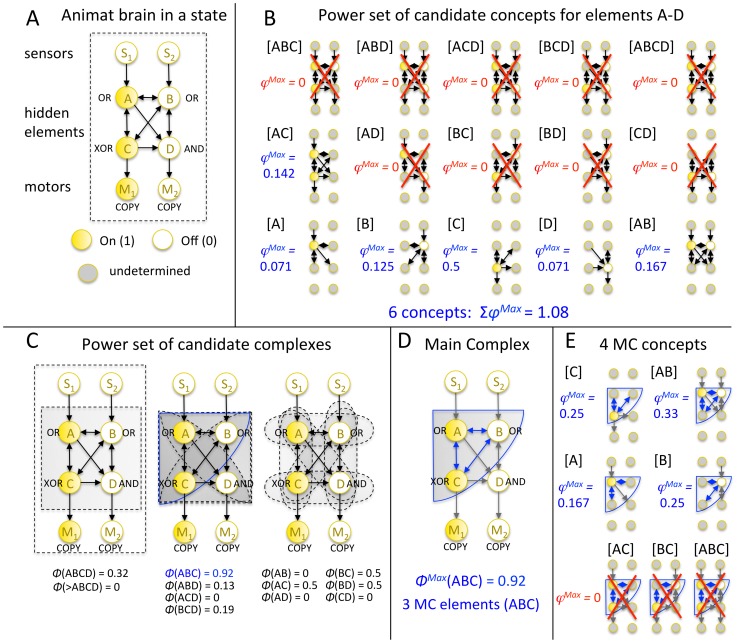
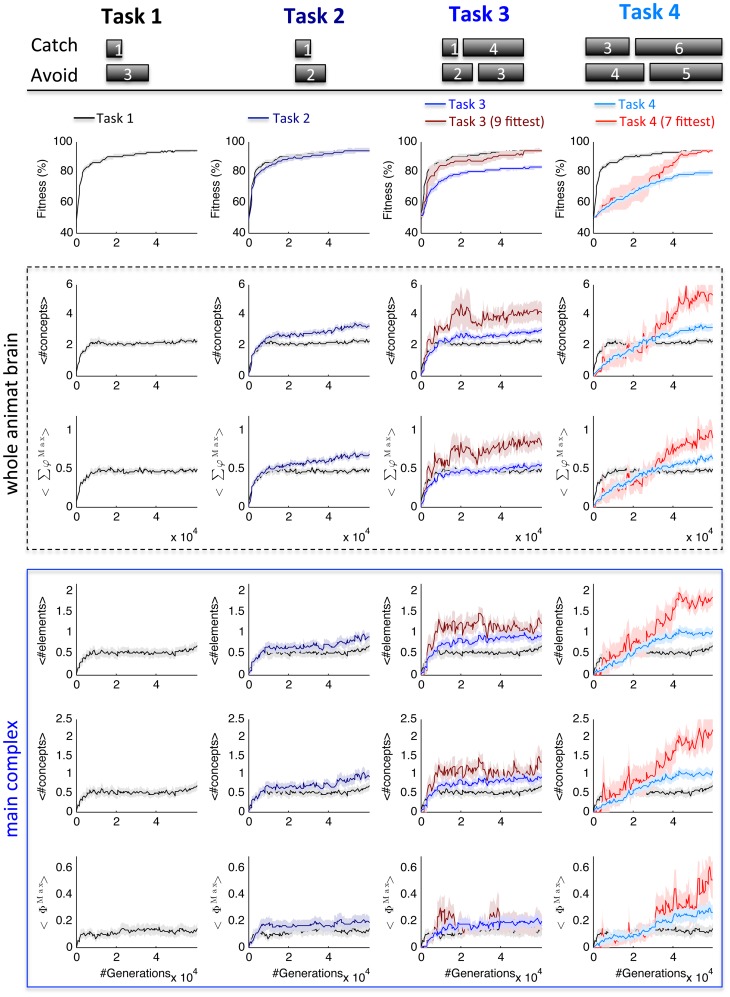
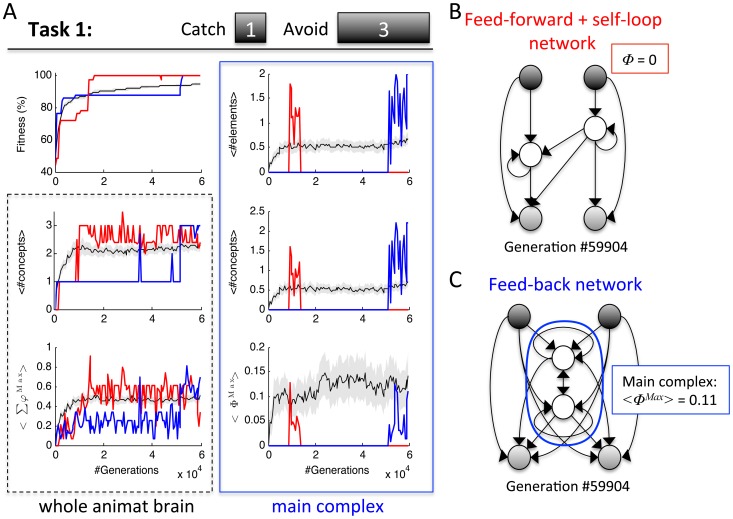
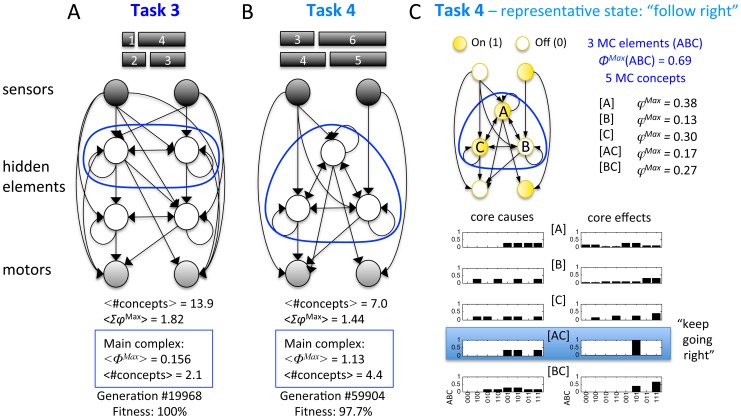
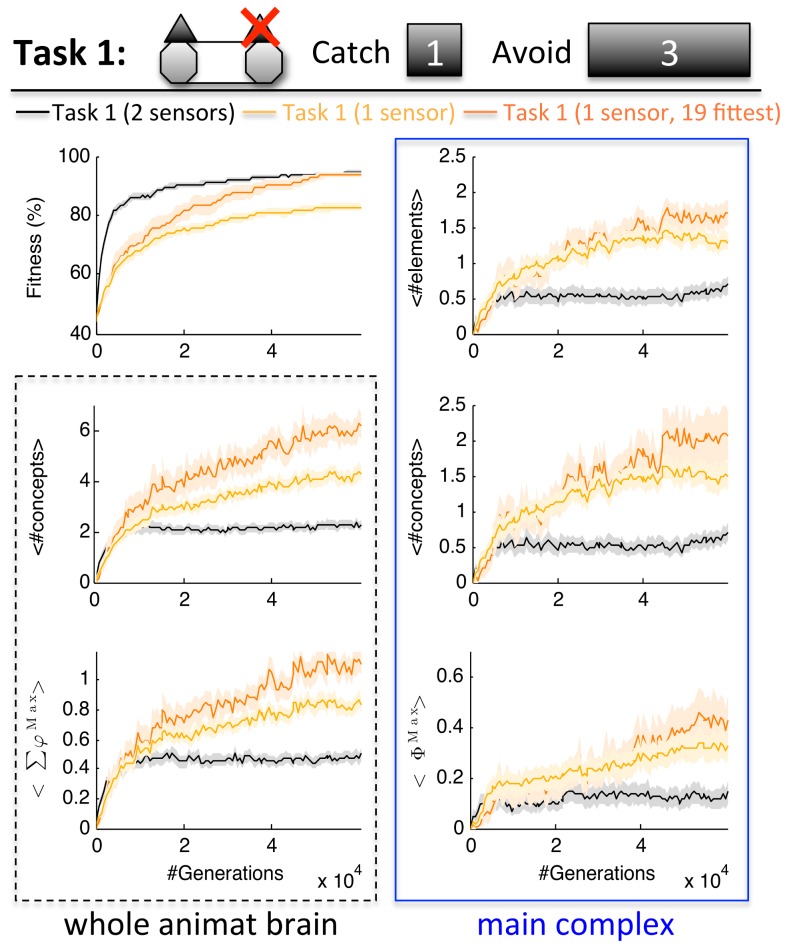
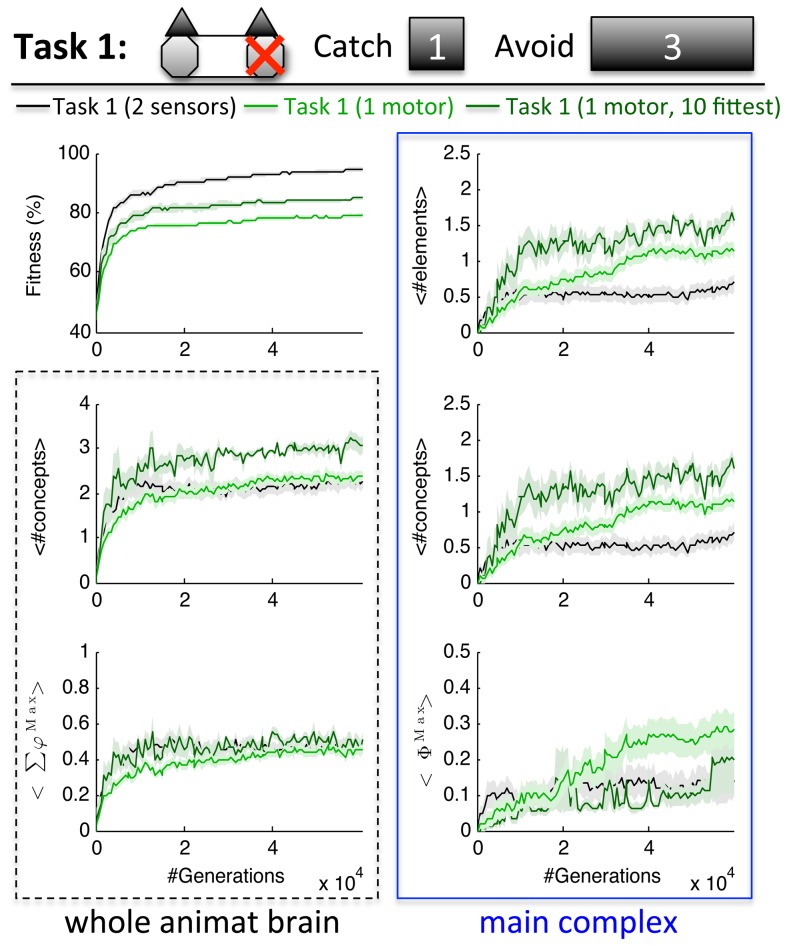
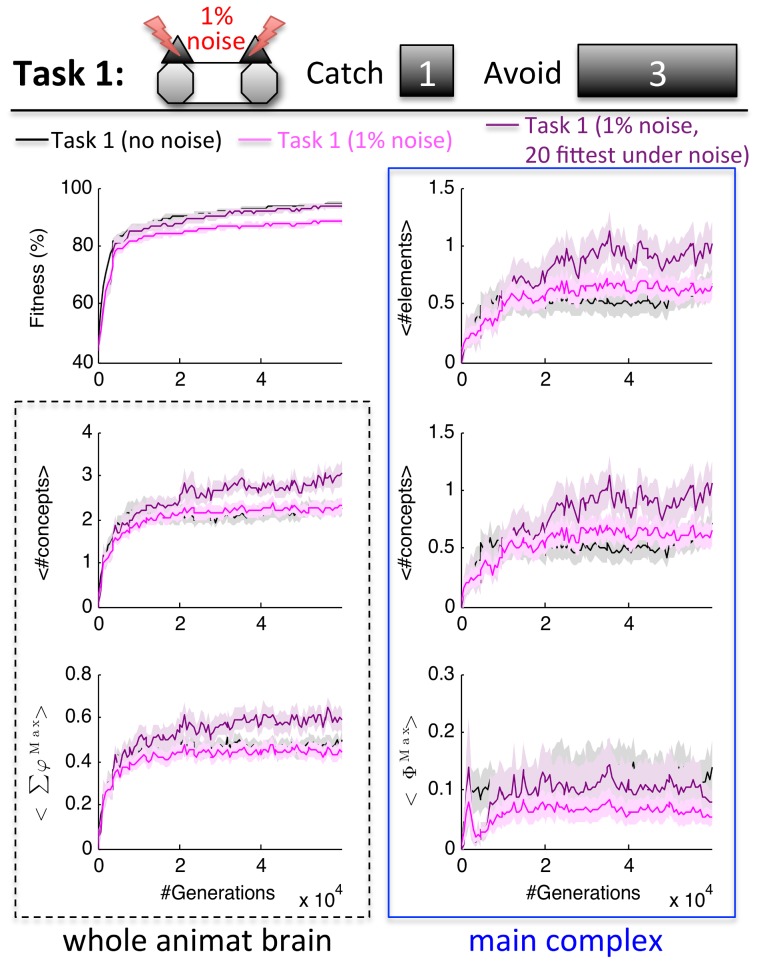
Natural selection favors the evolution of brains that can capture fitness-relevant features of the environment's causal structure. We investigated the evolution of small, adaptive logic-gate networks ("animats") in task environments where falling blocks of different sizes have to be caught or avoided in a 'Tetris-like' game. Solving these tasks requires the integration of sensor inputs and memory. Evolved networks were evaluated using measures of information integration, including the number of evolved concepts and the total amount of integrated conceptual information. The results show that, over the course of the animats' adaptation, i) the number of concepts grows; ii) integrated conceptual information increases; iii) this increase depends on the complexity of the environment, especially on the requirement for sequential memory. These results suggest that the need to capture the causal structure of a rich environment, given limited sensors and internal mechanisms, is an important driving force for organisms to develop highly integrated networks ("brains") with many concepts, leading to an increase in their internal complexity.


Conflict of interest statement

The authors have declared that no competing interests exist.

Figures

Figure 1
Figure 1. Animats and task environments.
(A) Exemplar wiring diagram. Elements without causal role (unconnected elements, or hidden elements with inputs or outputs only) are dashed. Sensor elements can connect directly to motor elements. No feedback to the sensor elements or from the motor elements is allowed. (B) Schematic of animat in exemplar environment with periodic boundary conditions at the vertical walls (if a block e.g. moves out on the left it will reappear on the right). The animat has to distinguish the size of the downward moving blocks and either catch or avoid them. The animat is 3 units wide with a space of 1 unit between its sensors. Per trial, one block is positioned at one of 16 possible starting positions, 36 units above the animat. (C,D) Blocks continuously move either to the left or right, one unit per time step and also down at one unit per time step. If a block is positioned above a sensor element, the sensor switches on. (C) Pattern of sensor activation for a block of size 2 in case the animat is not moving. (D) The same for a block of size 3. Blocks with size ≥3 can activate both sensors at the same time. (E) Illustration of Task 1–4.
Figure 2
Figure 2. Assessing the causal structure of an animat in a state.
(A) A hypothetical animat brain comprised of a logic-gate network with 2 sensors (S1S2), 4 hidden elements (ABCD), and 2 motors (M1M2) is analyzed for illustration in state 00-1010-10. (B) First, the power set of all candidate concepts in the entire animat brain is evaluated. Note that the sensors and motors cannot give rise to concepts or be part of higher order concepts since – by design - they either lack causes or effects (i.e., inputs or outputs) within the system. Each animat brain can thus maximally have 24−1 = 15 concepts (the power-set of the 4 hidden elements, excluding the empty set). “Small phi” φ measures how irreducible a mechanism's cause-effect repertoire is over a particular set of inputs and outputs. φMax is the integrated information of the most irreducible cause-effect repertoire of the mechanism. The number of concepts and ΣφMax are measures of all the brain's causal relations and their strength, both modular or feed-forward and integrated. Here, 6 concepts exist, 4 elementary concepts ([A], [B], [C], [D]) and 2 higher order concepts ([AB], [AC]). All other higher order mechanisms are reducible (φMax = 0). (C) Second, Φ (“big phi”) is evaluated for all subsets of the system (candidate complexes). Φ measures how integrated a set of elements is. It quantifies how much the concepts of the set of elements change under a unidirectional partition between elements (for example, “noising” the connections from A to the rest of the system, leaving the connections to A from the system intact, see Methods). During the analysis, elements outside of the candidate complex are taken as fixed background conditions and remain unperturbed. Note that all subsets that contain either a sensor or a motor have Φ = 0, because elements that are connected to the rest of the system in a feed-forward manner cannot be part of an integrated system (see Methods). An animat's main complex can thus contain at most the 4 hidden elements. (D) Of all subsets of elements, in this particular system state, ABC is maximally integrated (ΦMax = 0.92) and thus forms the main complex (MC). Gray arrows denote fixed background conditions, blue arrows denote functional connections within the MC. (E) Out of the power-set of ABC (maximally 23−1 = 7 possible concepts), the MC specifies 4 irreducible concepts. The number of elements of the main complex, the number of MC concepts, and ΦMax measure different aspects of how integrated the animat's brain is. For each animat at a particular generation, the analysis is performed for every state of the animat's brain, while the animat is performing its particular task. The state-dependent values are then averaged, weighted by the probability of occurrence of each state over 128 trials of different blocks falling.
Figure 3
Figure 3. Comparison of concepts and integration across different task environments.
Fitness, the average number of concepts and their <ΣφMax> values in the whole animat brain, and the average number of MC elements, MC concepts, and <ΦMax> of Tasks 1–4 were measured for 50 independent LODs. All animats were evolved for 60,000 generations. Shaded areas indicate SEM. The block sizes that had to be caught or avoided for the respective tasks are indicated at the top. For comparison, Task 1 is shown in black in every column. Task 1: The average fitness increases rapidly at first (to ∼82% in 5000 generations), followed by a slower increase to 93% at generation 59,904. The mean number of concepts specified by all elements comprising the animats' brains and their mean <ΣφMax> increased during adaptation. The animats also developed main complexes with increasing mean number of MC elements, MC concepts, and mean <ΦMax> value, albeit with higher variability between the different LODs. Task 2: In contrast to Task 1, the two different block sizes in Task 2 could not be distinguished based on a momentary sensor state since both blocks are <3. The difficulty of Task 2 is similar to Task 1—the same average level of fitness is reached. Nevertheless, the animats developed more concepts and higher <ΣφMax>. Also the average MC measures show higher values in Task 2 for generations>40,000, but to a lesser degree (see text). Task 3/4: The animats had to distinguish four different block sizes. Task 3 and 4 were thus more difficult: the average fitness reached after 60,000 generations is lower (83% and 80%) than in Task 1 and 2 (93% and 94%). The average measures across all 50 LODs are shown in blue (columns 3 and 4). To compare the causal measures independent of differences in fitness, we also analyzed the subsets of LODs with highest final fitness that on average best matched that of Task 1 (shown in red, columns 3 and 4, see Methods). As expected, in Task 3, only the subset that reached high fitness evolved more concepts than Task 1. Yet, even considering all 50 LODs, MC measures showed higher values, similar to those of Task 2. In Task 4 all causal measures reached higher values than in Task 1, particularly for the subset of LODs with high fitness.
Figure 4
Figure 4. Task 1 can be solved in a modular and integrated manner.
(A) Evolution of fitness, concepts, and integration across 60,000 generation. Two individual LODs are shown for two evolutionary histories in which the animats reached perfect fitness: in one history (blue) the animats developed an integrated main complex (<ΦMax>  = 0.10 at generation 59,904); in the other history (red), the animats developed a feed-forward structure with two self-loops (ΦMax = 0 at generation 59,904). The red LOD, moreover, is a good example for dissociation between the MC measures and the number of concepts and their <ΣφMax> in the whole animat brain (generation 13,824). As in Fig. 3, the average across 50 animats (LODs) is shown in black, SEM in gray. (B) Wiring diagram at generation 59,904 for the red LOD that developed a modular network. (C) Wiring diagram at generation 59,904 for the blue LOD that developed an integrated network.
Figure 5
Figure 5. Wiring diagrams of fittest animats in Task 3 and 4.
(A) In Task 3, perfect fitness was achieved temporarily in one LOD only. The fittest evolved animat had 4 hidden elements; two of them form a main complex. <#concept>, <ΣφMax>, and <ΦMax> are averages across all states experienced by the animat while performing the task weighted by probability of occurrence of each state. Note that this perfect Task 3 animat developed a very large overall number of concepts and high <ΣφMax>, while its MC values are comparable to Task 1/2 animats with perfect fitness and integrated MCs (Fig. 4C). (B) In Task 4, the fittest animat achieved a fitness level of 97.7%. The animat's hidden elements formed a main complex in all experienced states. Shown is the largest MC consisting of all 3 evolved hidden elements. In some states, however, the MC was comprised of only two hidden elements. Note that the average number of MC concepts was higher than the maximal number of 3 MC elements, which means that the main complex gave rise to higher order concepts. (C) Conceptual structure of the animat shown in B, for one representative state. This state is active, whenever the animat follows a block to the right (right sensor and motor are on). The animat's conceptual structure comprises 5 MC concepts, the elementary concepts A, B, and C and the 2nd order concepts AC and BC. The cause-effect repertoires of the MC concepts are always about the elements within the main complex (ABC). Nevertheless, some concepts allow for interpretation from an extrinsic point of view: the higher order concept AC = 11, for example, specifies that coming from any of three possible past states (ABC = 001, 101, or 111), the next state of ABC will again be 101. Since this state is associated with switching the right motor on, the concept AC can be interpreted as “keep going right”. Interestingly, in the state associated with “follow left” (not shown), a corresponding 2nd order concept AB = 11 exists, which can be interpreted as “keep going left”.
Figure 6
Figure 6. Concepts and integration in Task 1 with just one functioning sensor.
Given only one sensor, Task 1 requires sequential memory for block and direction categorization. As a consequence the animats developed brains with more concepts and main complexes with more elements, concepts, and higher ΦMax than with two sensors. The number of evolved concepts and their integration in Task 1 with one sensor was comparable to Task 4, the task that requires most sequential memory (Fig. 3, 4th column).
Figure 7
Figure 7. Concepts and integration in Task 1 with just one functioning motor.
Given only one motor, Task 1 requires sequential control of the motor element. As a consequence the animats developed main complexes with more elements, concepts, and higher ΦMax than with two motors. The subset of the 10 fittest animats with only one motor evolved even larger main complexes and also more concepts outside of the main complex.
Figure 8
Figure 8. Concepts and integration in Task 1 with 1% sensor noise.
The average fitness shown in the first plot is the percentage of correct trials in Task 1 tested in a noise-free environment. On average, adaptation with sensor noise decreased the animats' average fitness in the noise free environment of Task 1, without affecting the average number of concepts, <ΣφMax>, and the evolved main complexes. However, the subset of 20 LODs with the best final performance in the noisy environment (1% sensor noise, evaluated over 50 repetitions of each trial at generation 59,904) developed more concepts, <ΣφMax>, and larger main complexes with more MC concepts than those animats evolved in Task 1 without sensor noise, while reaching about the same level of fitness in the noise free condition.
Figure 9
Figure 9. The information, integration, and exclusion postulate applied at the level of mechanisms (A–C) and systems of mechanisms (D–F).
(A–F) Each node is a binary logic-gate mechanism that can be in either state ‘0’ (white) or ‘1’ (yellow). The logic-gates and their connections are represented as neural circuits rather than electronic circuits: directed connections between the nodes indicate the inputs and outputs of the logic gates. The mechanisms labeled A, B, and C correspond to system ABC = 101 shown in (D). (A) Information: Mechanism C in its current state ‘1’ generates information as it constrains its causes (the past states of its inputs AB) and effects (the future states of its outputs AB) compared to their unconstrained distributions (gray distribution). Past and future nodes whose state is unspecified are shown in gray. (B) Integration: The elements X and Y do not form an integrated higher order mechanism, since XY is reducible to its component mechanisms X and Y (φ = 0). However, the elements AB in state ‘10’ do form a higher order mechanism, since AB specifies both, irreducible causes and irreducible effects (the minimum information partition (MIP) on both, the cause and effect side leads to a loss of information). Integrated information φ of AB = 10 is evaluated as the minimum of the cause and effect integrated information: φ =  min(φCause, φEffect), here φ =  φEffect  = 0.25, taking all inputs and outputs of AB into account. The overall MIP of AB over all its inputs and outputs is thus MIPEffect, labeled in red. (C) Exclusion: Of all input-output combinations of mechanism AB, the “concept” of AB = 10 is its maximally irreducible cause repertoire, here over all input elements ABC (φCause = 0.33, same as in (B)), together with its maximally irreducible effect repertoire, here over output element C only (φEffect = 0.5). This means that AB has its maximally irreducible effect repertoire specified on C, not on ABC or any other output combination. The concept's integrated information is φMax  =  min(φCause, φEffect)  =  φCause  = 0.33, its overall MIP is MIPCause, labeled in red. (D) System information: The system ABC = 101 gives rise to a conceptual structure with 4 concepts. (E) System integration: The system WXYZ is reducible into the subsets WX and YZ. WXYZ cannot exist as a system from the intrinsic perspective. By contrast, system ABC is irreducible. Its minimum information partition (MIP) leaves the concepts of A and B intact, but destroys concepts C and AB. Integrated conceptual information Φ(ABC) is evaluated as the difference between the whole conceptual structure C and the partitioned conceptual structure CMIP (see Text S2 in [15]). (F) System exclusion: Of all sets of elements in this larger system, the set ABC has ΦMax and thus forms the main “complex”. ABCD, for example, also specifies integrated conceptual information Φ, but cannot form another complex since it overlaps with ABC and Φ(ABC)> Φ(ABCD) (see Fig. 2).

References

    1. Maynard Smith J (2000) The Concept of Information in Biology. Philos Sci 67: 177–194.
    1. Polani D (2009) Information: currency of life? HFSP J 3: 307–316 10.2976/1.3171566 - DOI - PMC - PubMed
    1. Rivoire O, Leibler S (2011) The Value of Information for Populations in Varying Environments. J Stat Phys 142: 1124–1166 10.1007/s10955-011-0166-2 - DOI
    1. Adami C (2012) The use of information theory in evolutionary biology. Ann N Y Acad Sci 1256: 49–65 10.1111/j.1749-6632.2011.06422.x - DOI - PubMed
    1. Taylor SF, Tishby N, Bialek W (2007) Information and fitness.

Publication types

LinkOut - more resources