

Comparison of smoking cessation between education groups: findings from 2 US National Surveys over 2 decades
- PMID: 25521868
- PMCID: PMC4289455
- DOI: 10.2105/AJPH.2014.302222
Comparison of smoking cessation between education groups: findings from 2 US National Surveys over 2 decades
Abstract
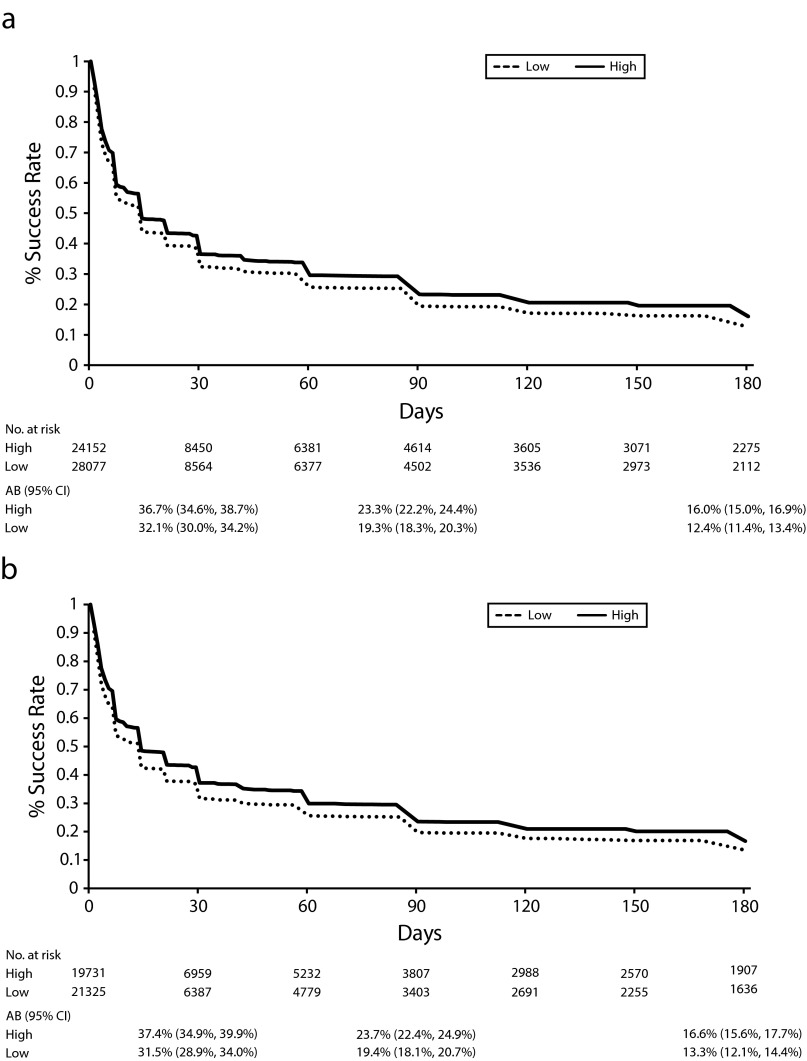
Objectives: We examined smoking cessation rate by education and determined how much of the difference can be attributed to the rate of quit attempts and how much to the success of these attempts.
Methods: We analyzed data from the National Health Interview Survey (NHIS, 1991-2010) and the Tobacco Use Supplement to the Current Population Survey (TUS-CPS, 1992-2011). Smokers (≥ 25 years) were divided into lower- and higher-education groups (≤ 12 years and >12 years).
Results: A significant difference in cessation rate between the lower- and the higher-education groups persisted over the last 2 decades. On average, the annual cessation rate for the former was about two thirds that of the latter (3.5% vs 5.2%; P<.001, for both NHIS and TUS-CPS). About half the difference in cessation rate can be attributed to the difference in quit attempt rate and half to the difference in success rate.
Conclusions: Smokers in the lower-education group have consistently lagged behind their higher-education counterparts in quitting. In addition to the usual concern about improving their success in quitting, tobacco control programs need to find ways to increase quit attempts in this group.
Figures


References
-
- Pierce JP, Fiore MC, Novotny TE, Hatziandreu EJ, Davis RM. Trends in cigarette smoking in the United States: educational differences are increasing. JAMA. 1989;261(1):56–60. - PubMed
-
- Iribarren C, Luepker RV, McGovern PG, Arnett DK, Blackburn H. Twelve-year trends in cardiovascular disease risk factors in the Minnesota Heart Survey: are socioeconomic differences widening? Arch Intern Med. 1997;157(8):873–881. - PubMed
-
- Kanjilal S, Gregg EW, Cheng YJ et al. Socioeconomic status and trends in disparities in 4 major risk factors for cardiovascular disease among US adults, 1971–2002. Arch Intern Med. 2006;166(21):2348–2355. - PubMed
Publication types
MeSH terms
Grants and funding
LinkOut - more resources
Full Text Sources
Medical
