

Critical care bed growth in the United States. A comparison of regional and national trends
- PMID: 25522054
- PMCID: PMC4351597
- DOI: 10.1164/rccm.201409-1746OC
Critical care bed growth in the United States. A comparison of regional and national trends
Abstract
Rationale: Although the number of intensive care unit (ICU) beds in the United States is increasing, it is unknown whether this trend is consistent across all regions.
Objectives: We sought to better characterize regional variation in ICU bed changes over time and identify regional characteristics associated with these changes.
Methods: We used data from the Centers for Medicare and Medicaid Services and the U.S. Census to summarize the numbers of hospitals, hospital beds, ICU beds, and ICU occupancy at the level of Dartmouth Atlas hospital referral region from 2000 to 2009. We categorized regions into quartiles of bed change over the study interval and examined the relationship between change categories, regional characteristics, and population characteristics over time.
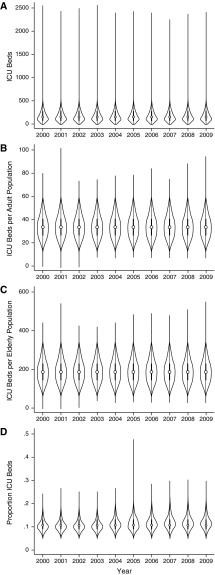
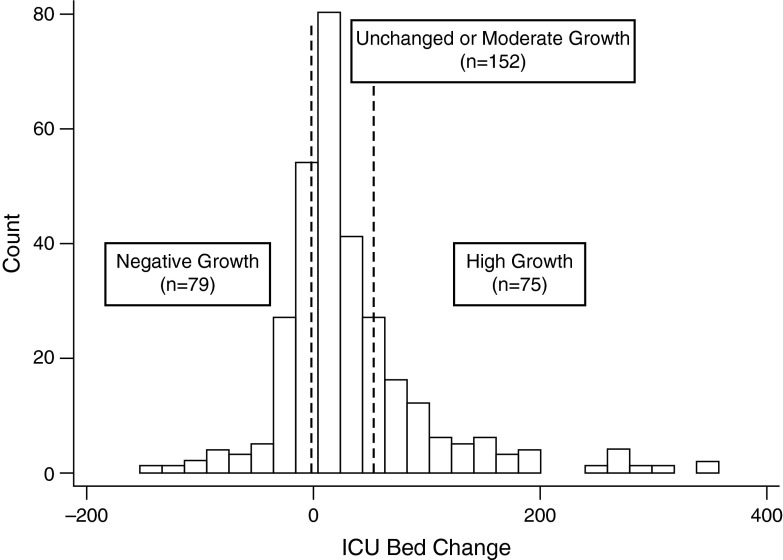
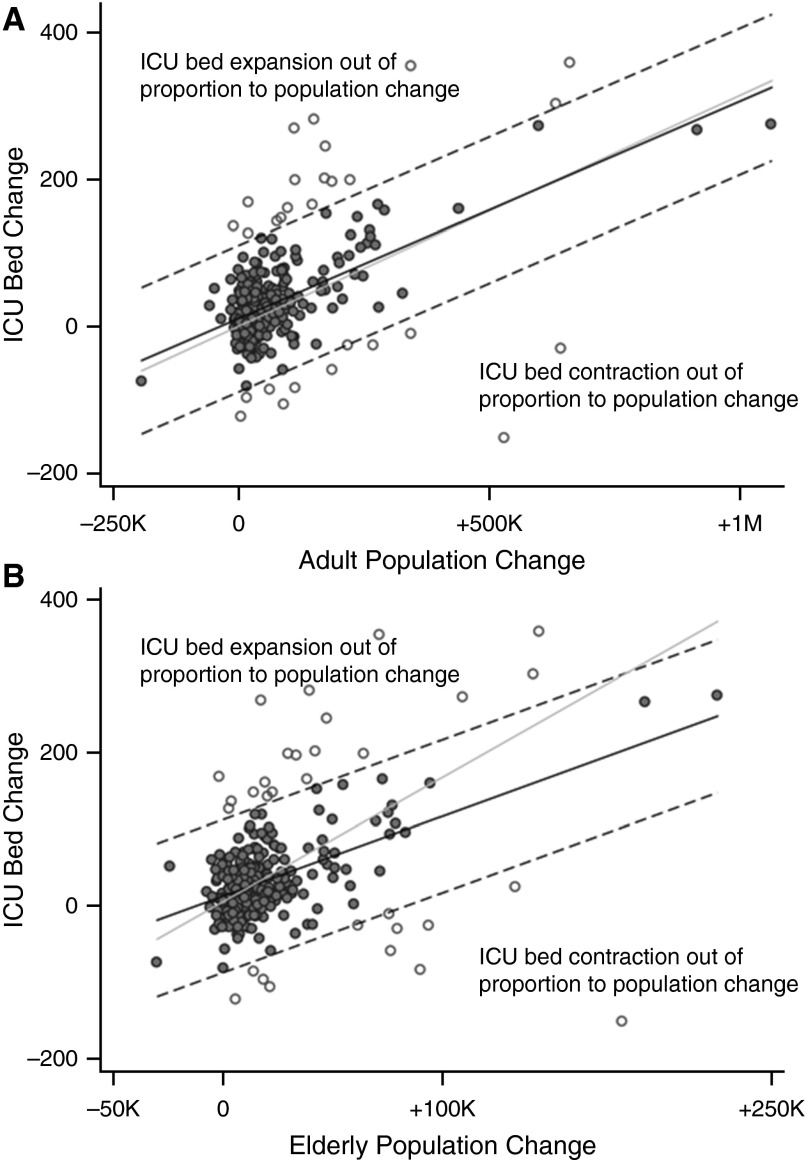
Measurements and main results: From 2000 to 2009 the national number of ICU beds increased 15%, from 67,579 to 77,809, mirroring population. However, there was substantial regional variation in absolute changes (median, +16 ICU beds; interquartile range, -3 to +51) and population-adjusted changes (median, +0.9 ICU beds per 100,000; interquartile range, -3.8 to +5.9), with 25.0% of regions accounting for 74.8% of overall growth. At baseline, regions with increasing numbers of ICU beds had larger populations, lower ICU beds per 100,000 capita, higher average ICU occupancy, and greater market competition as measured by the Herfindahl-Hirschman Index (P < 0.001 for all comparisons).
Conclusions: National trends in ICU bed growth are not uniformly reflected at the regional level, with most growth occurring in a small number of highly populated regions.
Keywords: bed supply; critical care; infrastructure; intensive care unit.
Figures
Comment in
-
Insights into intensive care unit bed expansion in the United States. National and regional analyses.Am J Respir Crit Care Med. 2015 Feb 15;191(4):365-6. doi: 10.1164/rccm.201501-0043ED. Am J Respir Crit Care Med. 2015. PMID: 25679100 No abstract available.
References
-
- The World Bank. Data [accessed 2014 Sept 1]. Available fromhttp://data.worldbank.org
-
- Halpern NA, Pastores SM. Critical care medicine in the United States 2000-2005: an analysis of bed numbers, occupancy rates, payer mix, and costs. Crit Care Med. 2010;38:65–71. - PubMed
-
- Gooch RA, Kahn JM. ICU bed supply, utilization, and health care spending: an example of demand elasticity. JAMA. 2014;311:567–568. - PubMed
-
- Singer DE, Carr PL, Mulley AG, Thibault GE. Rationing intensive care—physician responses to a resource shortage. N Engl J Med. 1983;309:1155–1160. - PubMed
-
- Stelfox HT, Hemmelgarn BR, Bagshaw SM, Gao S, Doig CJ, Nijssen-Jordan C, Manns B. Intensive care unit bed availability and outcomes for hospitalized patients with sudden clinical deterioration. Arch Intern Med. 2012;172:467–474. - PubMed
Publication types
MeSH terms
Grants and funding
LinkOut - more resources
Full Text Sources
