. 2014 Dec 18;10(12):e1004766.
doi: 10.1371/journal.pgen.1004766. eCollection 2014 Dec.

Plasmid flux in Escherichia coli ST131 sublineages, analyzed by plasmid constellation network (PLACNET), a new method for plasmid reconstruction from whole genome sequences

Affiliations

Plasmid flux in Escherichia coli ST131 sublineages, analyzed by plasmid constellation network (PLACNET), a new method for plasmid reconstruction from whole genome sequences

Val F Lanza et al. PLoS Genet. .

Abstract

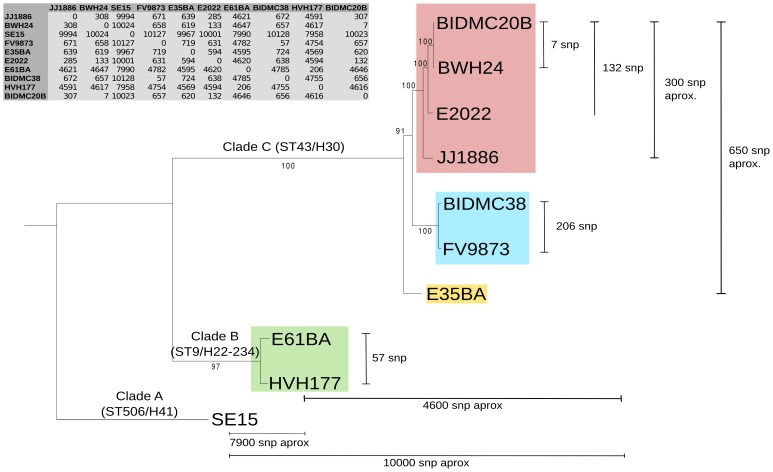
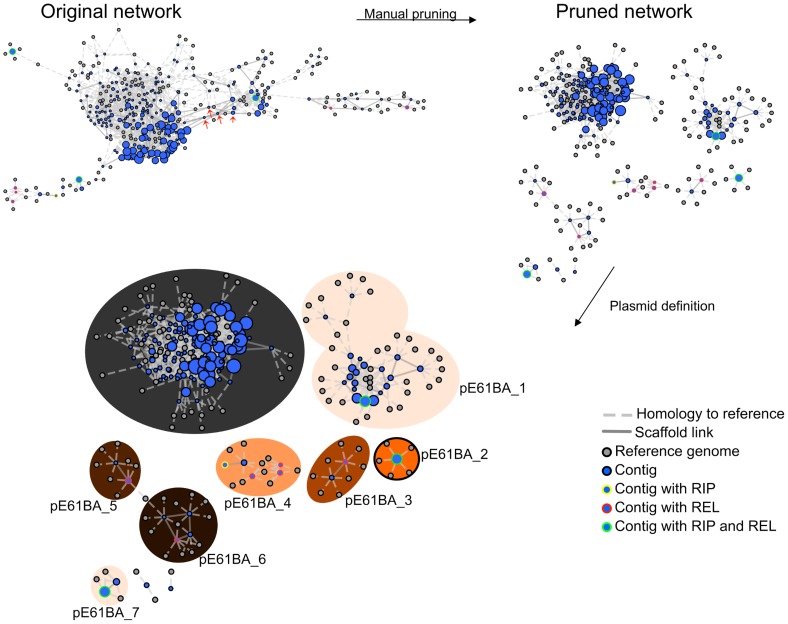
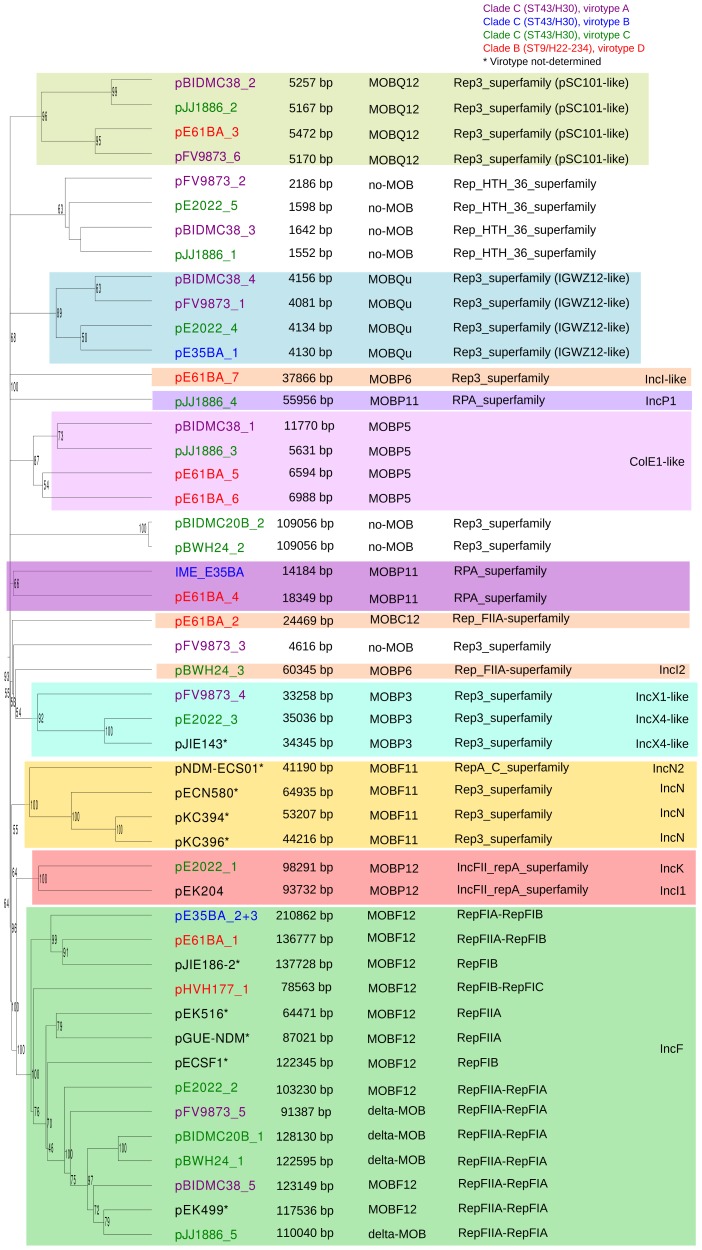
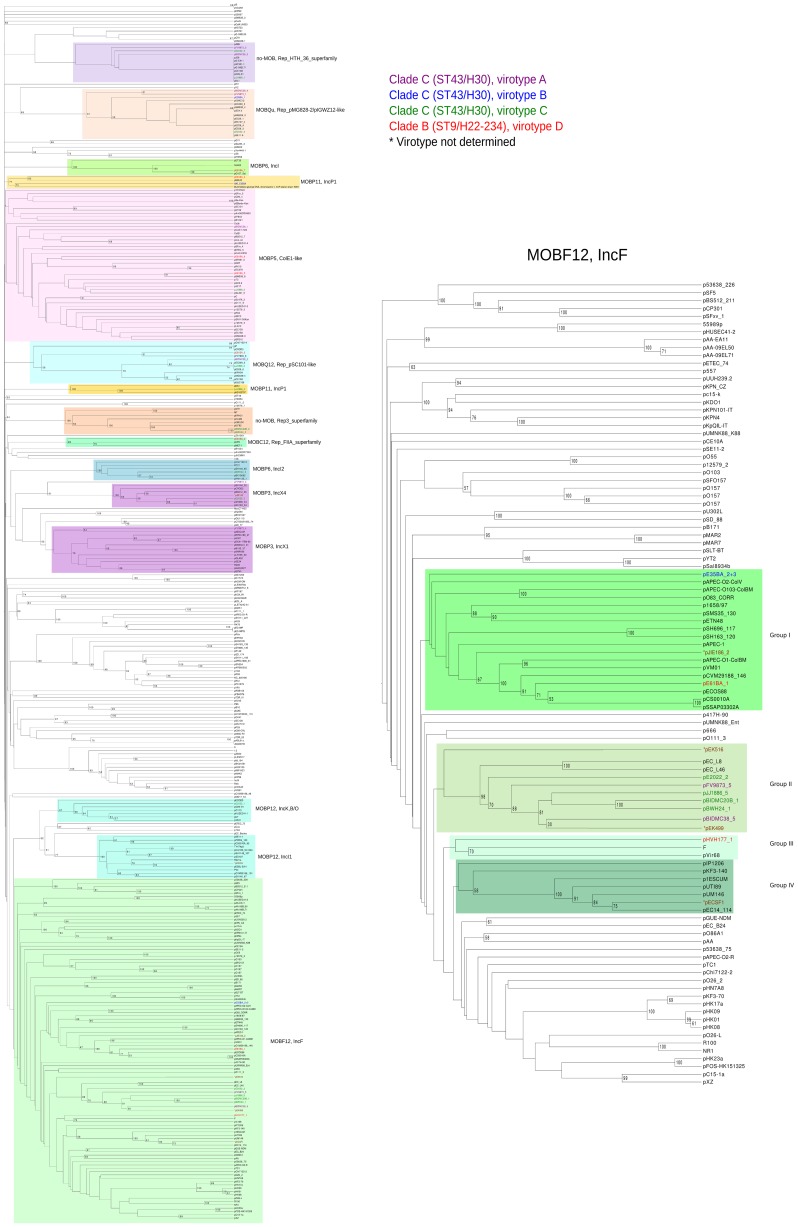
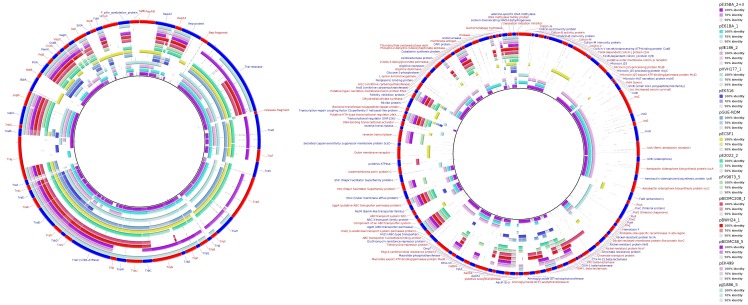
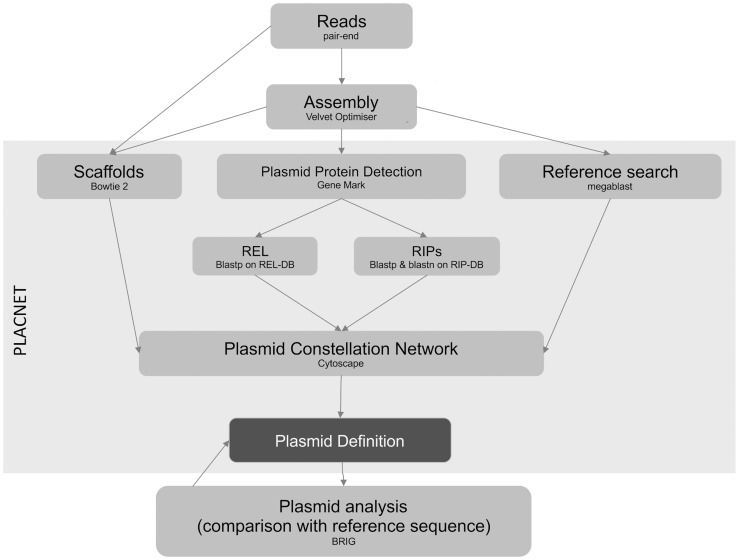
Bacterial whole genome sequence (WGS) methods are rapidly overtaking classical sequence analysis. Many bacterial sequencing projects focus on mobilome changes, since macroevolutionary events, such as the acquisition or loss of mobile genetic elements, mainly plasmids, play essential roles in adaptive evolution. Existing WGS analysis protocols do not assort contigs between plasmids and the main chromosome, thus hampering full analysis of plasmid sequences. We developed a method (called plasmid constellation networks or PLACNET) that identifies, visualizes and analyzes plasmids in WGS projects by creating a network of contig interactions, thus allowing comprehensive plasmid analysis within WGS datasets. The workflow of the method is based on three types of data: assembly information (including scaffold links and coverage), comparison to reference sequences and plasmid-diagnostic sequence features. The resulting network is pruned by expert analysis, to eliminate confounding data, and implemented in a Cytoscape-based graphic representation. To demonstrate PLACNET sensitivity and efficacy, the plasmidome of the Escherichia coli lineage ST131 was analyzed. ST131 is a globally spread clonal group of extraintestinal pathogenic E. coli (ExPEC), comprising different sublineages with ability to acquire and spread antibiotic resistance and virulence genes via plasmids. Results show that plasmids flux in the evolution of this lineage, which is wide open for plasmid exchange. MOBF12/IncF plasmids were pervasive, adding just by themselves more than 350 protein families to the ST131 pangenome. Nearly 50% of the most frequent γ-proteobacterial plasmid groups were found to be present in our limited sample of ten analyzed ST131 genomes, which represent the main ST131 sublineages.


Conflict of interest statement

The authors have declared that no competing interests exist.

Figures

Figure 1
Figure 1. Phylogenetic tree of ST131 E. coli.
The tree is based on a 3,629,034 bp core genome (3,734 orthologous genes: 90% identity and 90% coverage) and 100 bootstrapping replicates. ST131 clades are named according to and further subdivided and colored according to virotypes : virotype A (blue), virotype B (yellow), virotype C (pink), virotype D (green). Virotype classification is based on the presence/absence of four putative virulence factors: afaFM955459 (encoding an Afa/Dr adhesin), sat (secreted autotransporter toxin, present in PAI-CFT073-pheV), ibeA (invasion of brain endothelium) and iroN (salmochelin siderophore receptor). The commensal ST131 strain SE15 was used to root the tree (virotype non typable; serotype O150 in the original publication but lying within the H41 cluster in the phylogenomic study of [16]). Given SNP numbers are approximate averages of individual comparisons.
Figure 2
Figure 2. PLACNET plasmid reconstruction of ST131 genome E61BA (ST9/H324/virotype D).
The network contains nodes of two different colors (blue for contigs, grey for reference genomes). The size of reference nodes is always the same. The size of the contig nodes is proportional to the contig length. Besides, outlines are yellow for contigs containing RIP proteins, red for relaxases and green for both proteins. Edges are either solid (scaffold links) of dotted (homologous references). The length of the edges is arbitrarily selected by Cytoscape algorithm. In the upper left, the network output (original network) is shown, which resulted from automatic reference search, scaffold links and protein tagging rules. The original network was converted to a pruned network by eliminating contigs smaller than 200 bp and duplicating specific hubs (red arrows). Two contigs could not be assigned for lack of scaffold links: a 2,953 bp contig (putative DNA primase + lytic transglycosylase) and a 1,301 bp contig (TrbI + TraB-partial). Closed plasmids (e.g., pE61BA_2, size: 24,447 bp) are shown with a black outline in the final PLACNET network.
Figure 3
Figure 3. Hierarchical clustering dendrogram of ST131 plasmids.
The UPGMA dendrogram was based on protein cluster analysis using 60% sequence identity and 80% coverage. Plasmid names are colored according to their clade, taking into account ST, fimH allele and virotype, following the color code shown at the upper right. The five plasmid names in black correspond to previously sequenced plasmids from ST131 strains. Different color backgrounds are shown to emphasize branches of related plasmids. To the right of the dendrogram, four columns show, respectively, plasmid size, MOB type, RIP type and Inc type.
Figure 4
Figure 4. Hierarchical clustering dendrogram of ST131 plasmids and relevant references.
The left dendrogram shows the complete tree, with references. Dendrogram construction and color codes are as in Fig. 4. The right dendrogram expands the MOBF12/IncF branch, with new background colors highlighting plasmid groups within this branch that are mentioned in the text.
Figure 5
Figure 5. MOBF12/IncF plasmid analysis.
Protein cluster analysis was performed with kClust software (parameters: 30% identity, 50% coverage) on the set of 14 plasmids shown in Table 4. Plasmid pGUE-NDM was excluded from this comparison since it is only distantly related to the others (see dendrogram in Fig. 5). A total of 354 protein clusters were obtained and annotated versus the NCBI protein database (Blastp). Manual inspection was carried out to classify the reference proteins of each cluster into one of these three groups (comparative analysis shown with BRIG): (i) Backbone and metabolic proteins (panel A); (ii) Virulence and Antibiotic resistance proteins (panel B); and (iii) ISs and hypothetical proteins (not shown).
Figure 6
Figure 6. PLACNET flow diagram.
The diagram represents the PLACNET workflow to analyze an Illumina bacterial genome dataset. It can be separated in two sub-process: network delineation and plasmid analysis. Network delineation consists on contig assembly, determination of scaffold interactions, reference search of homologous genomes and plasmid protein prediction. Plasmid analysis basically consists in the construction of a dendrogram of plasmid protein profiles, which identifies the most relevant reference sequences, followed by plasmid cluster analysis, which compares query plasmids with its closest references. Plasmid analysis is a feedback process that helps to resolve uncertainties and results in a final definition of plasmid and chromosome content.

References

    1. Didelot X, Bowden R, Wilson DJ, Peto TE, Crook DW (2012) Transforming clinical microbiology with bacterial genome sequencing. Nat Rev Genet 13: 601–612. - PMC - PubMed
    1. Johnson TJ, Nolan LK (2009) Pathogenomics of the virulence plasmids of Escherichia coli. Microbiol Mol Biol Rev 73: 750–774. - PMC - PubMed
    1. Carattoli A (2011) Plasmids in Gram negatives: molecular typing of resistance plasmids. Int J Med Microbiol 301: 654–658. - PubMed
    1. Carattoli A (2013) Plasmids and the spread of resistance. Int J Med Microbiol 303: 298–304. - PubMed
    1. Ahmed SA, Awosika J, Baldwin C, Bishop-Lilly KA, Biswas B, et al. (2012) Genomic comparison of Escherichia coli O104:H4 isolates from 2009 and 2011 reveals plasmid, and prophage heterogeneity, including shiga toxin encoding phage stx2. PLoS One 7: e48228. - PMC - PubMed

Publication types