. 2014 Dec 18;10(12):e1004880.
doi: 10.1371/journal.pgen.1004880. eCollection 2014 Dec.

Syd/JIP3 and JNK signaling are required for myonuclear positioning and muscle function

Affiliations

Syd/JIP3 and JNK signaling are required for myonuclear positioning and muscle function

Victoria K Schulman et al. PLoS Genet. .

Abstract

Highlighting the importance of proper intracellular organization, many muscle diseases are characterized by mispositioned myonuclei. Proper positioning of myonuclei is dependent upon the microtubule motor proteins, Kinesin-1 and cytoplasmic Dynein, and there are at least two distinct mechanisms by which Kinesin and Dynein move myonuclei. The motors exert forces both directly on the nuclear surface and from the cell cortex via microtubules. How these activities are spatially segregated yet coordinated to position myonuclei is unknown. Using Drosophila melanogaster, we identified that Sunday Driver (Syd), a homolog of mammalian JNK-interacting protein 3 (JIP3), specifically regulates Kinesin- and Dynein-dependent cortical pulling of myonuclei without affecting motor activity near the nucleus. Specifically, Syd mediates Kinesin-dependent localization of Dynein to the muscle ends, where cortically anchored Dynein then pulls microtubules and the attached myonuclei into place. Proper localization of Dynein also requires activation of the JNK signaling cascade. Furthermore, Syd functions downstream of JNK signaling because without Syd, JNK signaling is insufficient to promote Kinesin-dependent localization of Dynein to the muscle ends. The significance of Syd-dependent myonuclear positioning is illustrated by muscle-specific depletion of Syd, which impairs muscle function. Moreover, both myonuclear spacing and locomotive defects in syd mutants can be rescued by expression of mammalian JIP3 in Drosophila muscle tissue, indicating an evolutionarily conserved role for JIP3 in myonuclear movement and highlighting the utility of Drosophila as a model for studying mammalian development. Collectively, we implicate Syd/JIP3 as a novel regulator of myogenesis that is required for proper intracellular organization and tissue function.


Conflict of interest statement

The authors have declared that no competing interests exist.

Figures
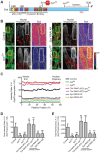
Figure 1
Figure 1. Syd is expressed in muscle tissue.
A) Diagram of Syd protein based on previous work and physical interaction data , , . Amino acid number indicated above at distinct points. Yellow, Khc Binding Domain (KBD); purple, JNK Binding Domain (JBD); green, Leucine Zipper (LZ), mediates Klc binding; red, coiled coil (cc) domains 1–5. N-terminus mediates Dynactin binding (LZ for mammalian JIP3 [21]). syd alleles are noted . Red line indicates the conserved region of Syd/JIP3 recognized by the C-terminal Syd antibody (S1A Fig.). B) (Left) Immunofluorescence projection images of the LT muscles in one hemisegment of stage 16 Drosophila embryos in the indicated genotypes. Green, Tropomyosin/muscles; red, dsRed/nuclei. Yellow boxes denote regions of higher magnification to the right. Scale bar, 10 µm. (Middle, Right) Higher magnification views used for analysis. Grayscale, Tropomyosin; red, nuclei (middle). Syd shown as a heatmap (right) to highlight regions of accumulation. Scale of relative intensities shown at lower right. Solid green lines outline the muscles as noted by Tropomyosin staining. Dotted green lines highlight the nuclei as noted by dsRed staining. White boxes denote regions used for analyses in C-E. Scale bar, 5 µm. C) Intensity profile of Syd immunofluorescence relative to Tropomyosin immunofluorescence plotted as a function of position normalized as a percentage of the total distance from the muscle end (left, 0%) to the nearest nucleus (right, 100%). D) Average peak intensity values for Syd immunofluorescence. E) Average total Syd immunofluorescence, determined by calculating the area under the curves in C. For each genotype in B-E, two LT muscles were measured in each of three hemisegments from ten embryos from at least three independent experiments. All error bars represent standard deviation. **, p<0.01 compared to controls (Student's t-test and ANOVA assessment). A.U., arbitrary units.
Figure 2
Figure 2. Syd is required to position myonuclei.
A–B) Immunofluorescence projection images of the LT muscles in one hemisegment of stage 16 Drosophila embryos of the indicated genotypes. Green, Tropomyosin/muscles; red, dsRed/nuclei. White brackets indicate the distance from the dorsal and ventral muscle ends and the nearest nucleus used for quantification of myonuclear position in C–D. Scale Bar, 10 µm. A) syd mutants B) Syd-RNAi expressed under the control of the indicated GAL4 driver. C–D) Histograms indicating the shortest distance between the indicated LT muscle end (Dorsal, grey; Ventral, white) and the nearest nucleus normalized for muscle length for the genotypes indicated in A–B. For each genotype in A–D, all four LT muscles were measured in each of three hemisegments from ten embryos from at least three independent experiments. All error bars represent standard deviation. **, p<0.01 compared to controls, ‘Dmef2-Gal4 Alone,’ and ‘No Gal4,’ unless otherwise noted by brackets (Student's t-test and ANOVA assessment).
Figure 3
Figure 3. syd genetically interacts with factors required for myonuclear positioning.
A) Immunofluorescence projection images of the LT muscles in one hemisegment of stage 16 Drosophila embryos of the indicated genotypes in which the syd allele was maternally provided. Green, Tropomyosin/muscles; red, dsRed/nuclei. Scale Bar, 10 µm. B) Histogram indicating the shortest distance between the indicated LT muscle end (Dorsal, grey; Ventral, white) and the nearest nucleus normalized for muscle length for the sydZ4 genetic interactions in A. C) Identical experiment as in A–B using the sydA2 allele in genetic interactions. For each genotype in A–C, all four LT muscles were measured in each of three hemisegments from ten embryos from at least three independent experiments. All error bars represent standard deviation. *, p<0.05; **, p<0.01 compared to wild-type and heterozygous controls (Student's t-test and ANOVA assessment).
Figure 4
Figure 4. Syd is required for Dynein localization.
A) (Left) Immunofluorescence projection images of the LT muscles in one hemisegment of stage 16 Drosophila embryos for the indicated genotypes. Green, Tropomyosin/muscles; red, dsRed/nuclei. Yellow boxes denote regions of higher magnification to the right used for analysis. Scale bar, 10 µm. (Middle, Right) Grayscale, Tropomyosin/muscles; red, dsRed/nuclei (middle); Heatmap, Dynein (right). Intensity scale, lower right. Solid and dotted green lines note the perimeter of the muscles and nuclei, respectively. White boxes denote regions used for analyses in B–D. Scale bar, 5 µm. B) Intensity profile of Dynein/Tropomyosin immunofluorescence plotted as a function of normalized position (muscle end, left, 0%; nucleus, right, 100%). C) Average peak intensity for Dynein immunofluorescence. D) Average total Dynein immunofluorescence. For each genotype in A–D, two LT muscles were measured in each of three hemisegments from ten embryos from at least three independent experiments. All error bars represent standard deviation. **, p<0.01 compared to controls (Student's t-test and ANOVA assessment). A.U., arbitrary units.
Figure 5
Figure 5. Kinesin is required for Syd localization.
A) (Left) Immunofluorescence projection images of the LT muscles in one hemisegment of stage 16 Drosophila embryos for the indicated genotypes. Green, Tropomyosin/muscles; red, dsRed/nuclei. Yellow boxes denote regions of higher magnification to the right used for analysis. Scale bar, 10 µm. (Middle, Right) Grayscale, Tropomyosin/muscles; red, dsRed/nuclei (middle); Heatmap, Syd (right). Intensity scale, lower right. Solid and dotted green lines note the perimeter of the muscles and nuclei, respectively. White boxes denote regions used for analyses in B–D. Scale bar, 5 µm. B) Intensity profile of Syd/Tropomyosin immunofluorescence plotted as a function of normalized position (muscle end, left, 0%; nucleus, right, 100%). C) Average peak intensity of Syd immunofluorescence. D) Average total Syd immunofluorescence. For each genotype in A–D, two LT muscles were measured in each of three hemisegments from ten embryos from at least three independent experiments. All error bars represent standard deviation. **, p<0.01 compared to controls (Student's t-test and ANOVA assessment). A.U., arbitrary units.
Figure 6
Figure 6. JNK signaling is required for Syd-mediated myonuclear positioning.
A–B) Identical assay as in Fig. 2. A) Stage 16 embryos of the indicated genotypes. Green, Tropomyosin/muscles; red, dsRed/nuclei. Scale Bar, 10 µm. B) Histogram indicating the shortest (normalized) distance of white brackets in A. C–F) Identical assay as in Fig. 4. C) (Left) Green, Tropomyosin; red, nuclei. Scale bar, 10 µm. (Middle, Right) Grayscale, Tropomyosin; red, nuclei; Heatmap, Dynein. Scale bar, 5 µm. Compare to control in Fig. 4A. D) Intensity profile of Dynein/Tropomyosin immunofluorescence plotted as a function of normalized position. E) Average peak intensity for Dynein immunofluorescence. F) Average total Dynein immunofluorescence. G–J) Identical assay as in Fig. 5. G) (Left) Green, Tropomyosin; red, nuclei. Scale bar, 10 µm. (Middle, Right) Grayscale, Tropomyosin; red, nuclei; Heatmap, Syd. Scale bar, 5 µm. Compare to control in Fig. 5A. H) Intensity profile of Syd/Tropomyosin immunofluorescence plotted as a function of normalized position. I) Average peak intensity for Syd immunofluorescence. J) Average total Syd immunofluorescence. For each genotype/experiment, all four LT muscles in A–B and at least two LT muscles in C-J were measured in each of three hemisegments from ten embryos from at least three independent experiments. All error bars represent standard deviation. *, p<0.05; **, p<0.01 compared to controls (Student's t-test and ANOVA assessment). A.U. arbitrary units.
Figure 7
Figure 7. Syd impacts muscle function.
A) Viability of syd mutants. B) Viability of embryos expressing Syd-RNAi in the muscle tissue driven by Dmef2-Gal4. C) Viability of embryos with disrupted JNK signaling in muscle tissue via Dmef2-Gal4 expression. D) Average velocity of Drosophila larvae as they crawled towards a stimulus. E) Immunofluorescence projection images of VL muscles in dissected L3 larvae that were previously used in locomotion assays. Red, Phalloidin/sarcomeres; white, Hoescht/nuclei. White brackets highlight internuclear distance. Arrows denote clumped myonuclei. Yellow dashed line, segment border. Scale bar, 20 µm. F) Average distance between each myonucleus and its nearest neighbor normalized for muscle length. G) Average length of the longest region of muscle tissue devoid of nuclei normalized for muscle length. H) Average number of nuclei per VL muscle. I) Average muscle length in the anterior-posterior axis. For each genotype, at least 300 embryos were assessed in A–C and at least 30 larvae were tracked in D from at least three independent experiments each. For each genotype in E–I, three VL muscles (1, 2, and 4) in six hemisegments from five larvae from at least three independent experiments were measured/counted. All error bars represent standard deviation. *, p<0.05; **, p<0.01 compared to controls unless otherwise noted by brackets (Student's t-test and ANOVA assessment). n.s., not significant.
Figure 8
Figure 8. Model of Syd-dependent myonuclear positioning.
Syd works in the cortical pulling pathway of myonuclear positioning, which requires cellular transport between the myonuclei (red) and the end of the muscle (green outline). (1) Kinesin, Dynein, and Syd are cytoplasmic proteins. Syd mediates (2) complex formation between Kinesin and Dynein and (3) promotes Kinesin-dependent transport of Dynein to the muscle ends in a JNK signaling-dependent manner. Microtubules contact the cell cortex in a CLIP-190-dependent manner . At the muscle end (4) Raps/Pins anchors Dynein to the cell cortex . The Dynein motor becomes active (5, thin arrow) and the net result (6, thick arrow) of cortically stabilized Dynein activity ultimately pulls the myonuclei into proper position. Syd may also work to initially organize Kinesin and Dynein near the nucleus (7) to specify a population of Kinesin to relocate Dynein out to the muscle ends (2) while the remaining Kinesin and Dynein exert forces on the nucleus to promote nuclear dynamics (7). In this manner, both mechanisms of myonuclear positioning work together to move myonuclei into proper position.

References

    1. Romero NB (2010) Centronuclear myopathies: a widening concept. Neuromuscul Disord 20: 223–228. - PubMed
    1. Jeannet PY, Bassez G, Eymard B, Laforet P, Urtizberea JA, et al. (2004) Clinical and histologic findings in autosomal centronuclear myopathy. Neurology 62: 1484–1490. - PubMed
    1. Puckelwartz MJ, Kessler E, Zhang Y, Hodzic D, Randles KN, et al. (2009) Disruption of nesprin-1 produces an Emery Dreifuss muscular dystrophy-like phenotype in mice. Hum Mol Genet 18: 607–620. - PMC - PubMed
    1. Metzger T, Gache V, Xu M, Cadot B, Folker ES, et al. (2012) MAP and kinesin-dependent nuclear positioning is required for skeletal muscle function. Nature 484: 120–124. - PMC - PubMed
    1. Folker ES, Schulman VK, Baylies MK (2012) Muscle length and myonuclear position are independently regulated by distinct Dynein pathways. Development 139: 3827–3837. - PMC - PubMed

Publication types

LinkOut - more resources