. 2015 Mar-Apr;19(2):146-55.
doi: 10.1016/j.bjid.2014.10.004. Epub 2014 Dec 15.

São Paulo urban heat islands have a higher incidence of dengue than other urban areas

Affiliations

São Paulo urban heat islands have a higher incidence of dengue than other urban areas

Ricardo Vieira Araujo et al. Braz J Infect Dis. 2015 Mar-Apr.

Abstract

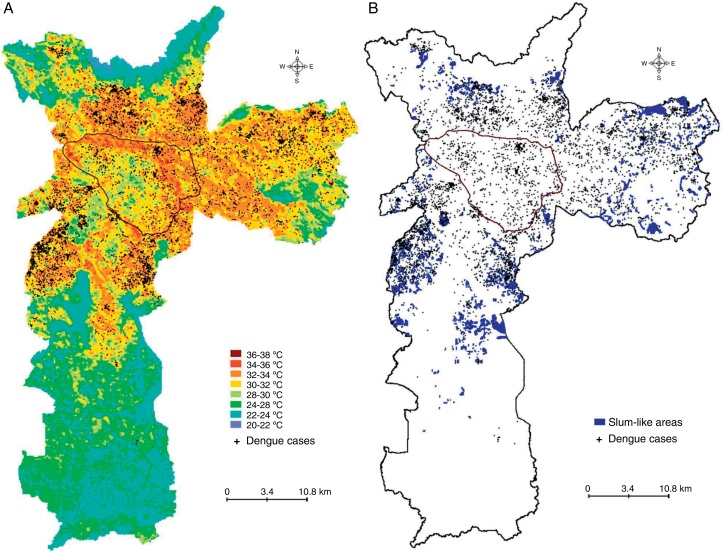
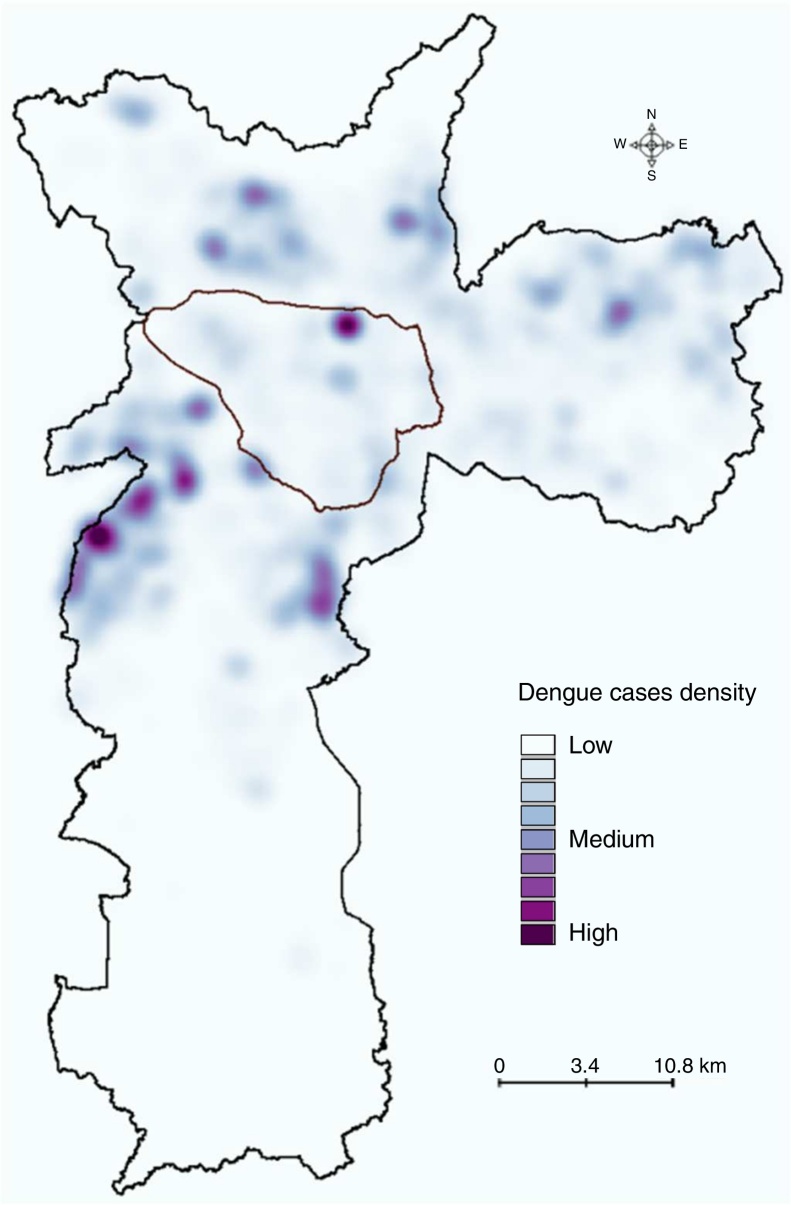
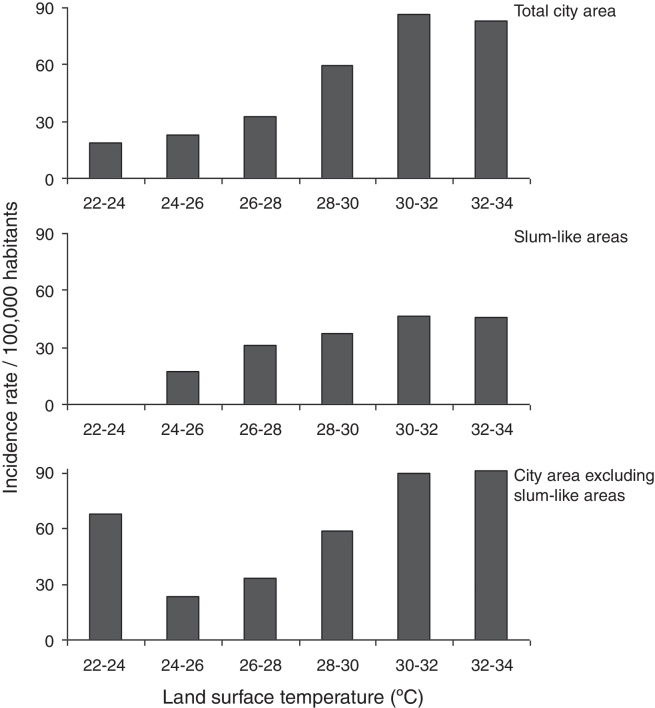
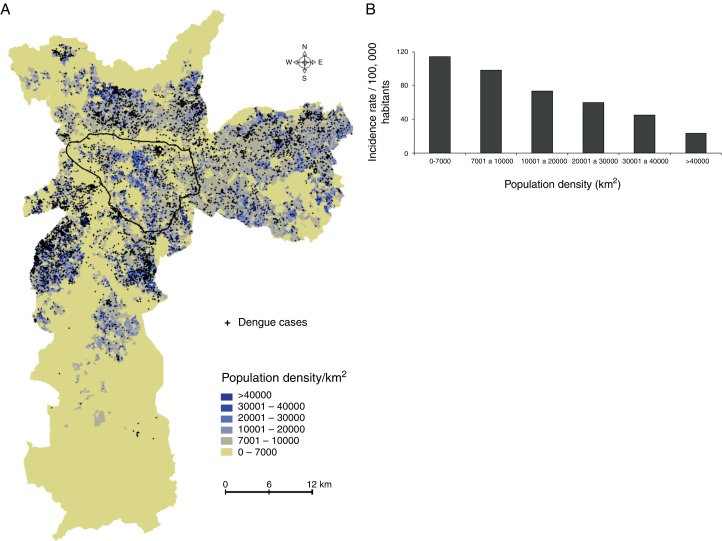
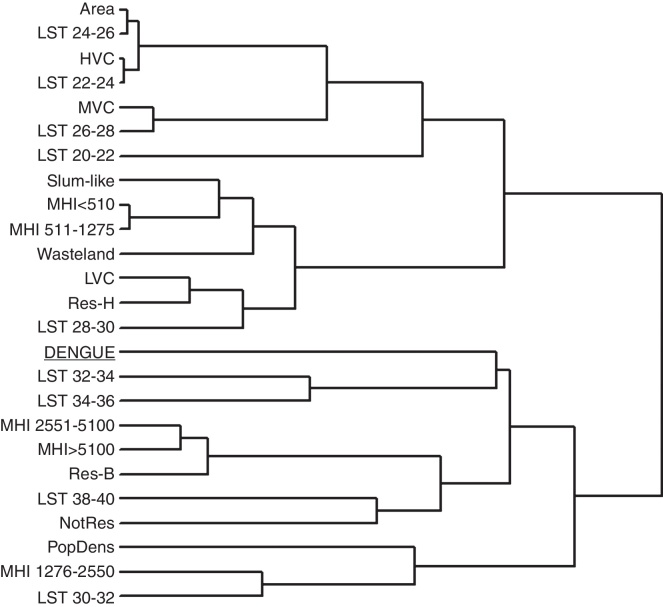
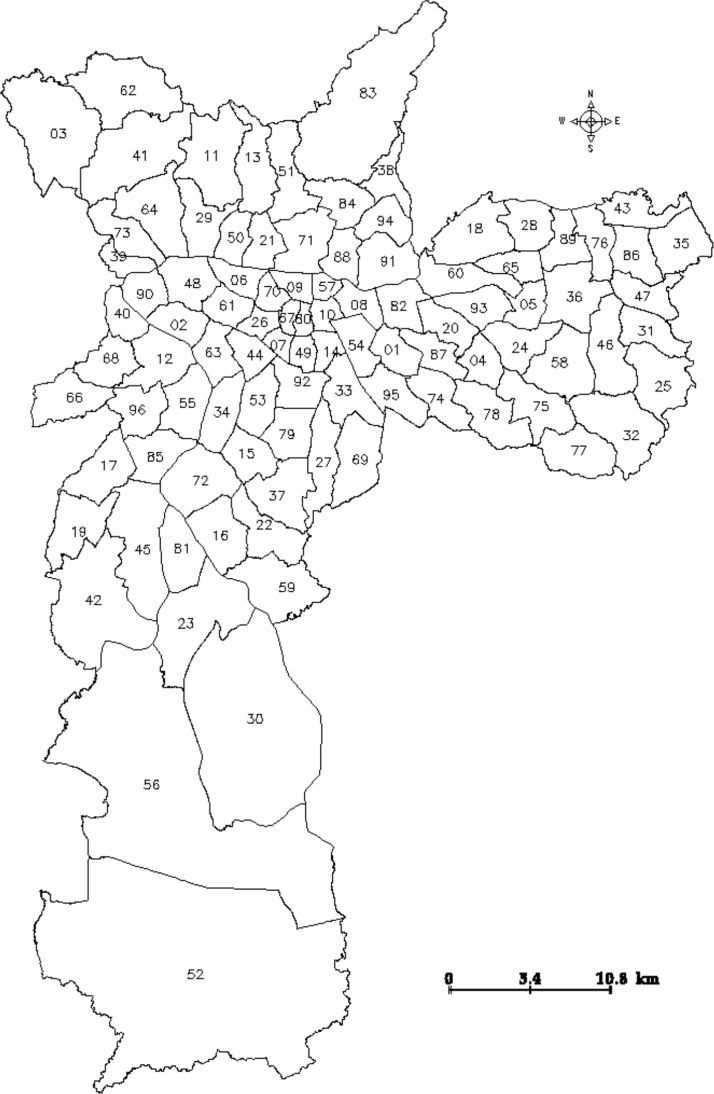
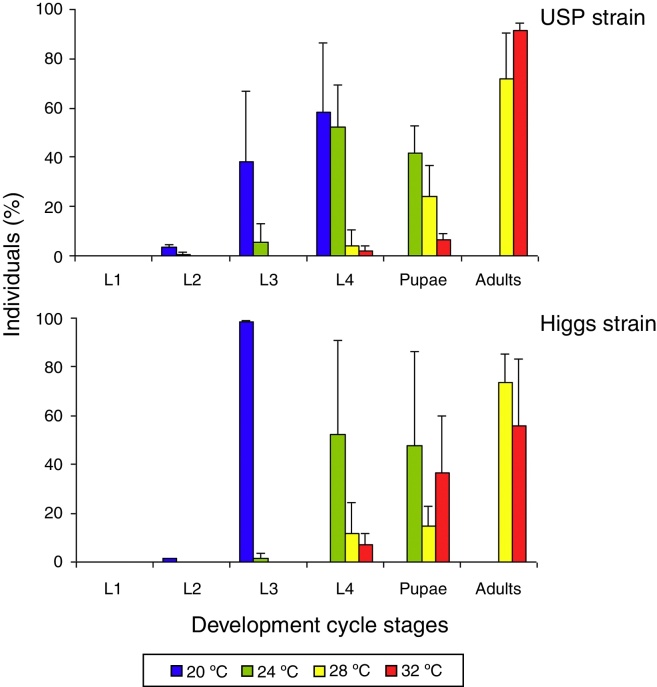
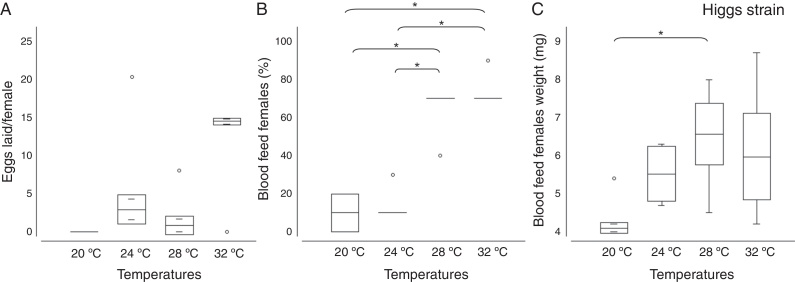
Urban heat islands are characterized by high land surface temperature, low humidity, and poor vegetation, and considered to favor the transmission of the mosquito-borne dengue fever that is transmitted by the Aedes aegypti mosquito. We analyzed the recorded dengue incidence in Sao Paulo city, Brazil, in 2010-2011, in terms of multiple environmental and socioeconomic variables. Geographical information systems, thermal remote sensing images, and census data were used to classify city areas according to land surface temperature, vegetation cover, population density, socioeconomic status, and housing standards. Of the 7415 dengue cases, a majority (93.1%) mapped to areas with land surface temperature >28°C. The dengue incidence rate (cases per 100,000 inhabitants) was low (3.2 cases) in high vegetation cover areas, but high (72.3 cases) in low vegetation cover areas where the land surface temperature was 29±2°C. Interestingly, a multiple cluster analysis phenogram showed more dengue cases clustered in areas of land surface temperature >32°C, than in areas characterized as low socioeconomic zones, high population density areas, or slum-like areas. In laboratory experiments, A. aegypti mosquito larval development, blood feeding, and oviposition associated positively with temperatures of 28-32°C, indicating these temperatures to be favorable for dengue transmission. Thus, among all the variables studied, dengue incidence was most affected by the temperature.

Keywords: Aedes aegypti; Dengue; Land surface temperature; Urban heat islands; Vegetation cover.


Figures

Fig. 1
Fig. 1
The distribution of dengue cases by temperature zones and slum-like areas. Land surface temperature (A), and slum-like areas (B) were geocoded using vector data (scale, 1/10,000). The area outlined in black is the main commercial and financial zone of São Paulo.
Fig. 2
Fig. 2
Kernel estimation of the distribution of dengue cases in São Paulo during 2010–211. A kernel map was built using the spatial point distribution of the 7,415 dengue cases reported during 2010–2011. The area outlined in black is the main commercial and financial zone of São Paulo.
Fig. 3
Fig. 3
Dengue incidence in urban heat islands. Geocoded cases were divided according to the land surface temperature, and the incidence rate was calculated by dividing the number of cases by the population of that area, and multiplying the quotient by 100,000.
Fig. 4
Fig. 4
Dengue incidence by population density. (A) Population densities were calculated using census tracts data (inhabitants/km2), and (B) dengue incidence (cases per 100,000 inhabitants) in the population density zones was calculated. The area outlined in black is the main commercial and financial zone of São Paulo.
Fig. 5
Fig. 5
Dengue incidence by vegetation cover. (A) Dengue cases and vegetation cover areas were geocoded using geographical information systems. (B) The dengue incidence (cases per 100,000 inhabitants) and (C) land surface temperatures in the low, moderate, or high vegetation cover zones are shown.
Fig. 6
Fig. 6
Multivariate cluster analysis of socioeconomic status, environmental conditions, and dengue incidence (cases per 100,000 inhabitants) for the Administrative Districts of São Paulo. A complete linkage phenogram of Euclidean dissimilarity distances among these variables was plotted. Branches distances are mutually proportional. Abbreviations: Area, territorial extension (km2); Dengue, dengue incidence; LST, land surface temperature; MHI, monthly household income; HVC, high vegetation cover; MVC, moderate vegetation cover; LVC, low vegetation cover; Res-H, predominantly residential houses; Res-B, predominantly residential buildings; NotRes, minimal residential use (typically commercial or industrial); PopDens, population density.
Fig. S1
Fig. S1
The Administrative Districts (ADs) of São Paulo. The ADs are identified by their numbers, and their demographic and environmental features are listed in Tables S2 and S3.
Fig. 7
Fig. 7
Temperature influence on A. aegypti life cycle. Four groups of fifty larvae each were separated after the eggs hatched, and maintained at 20 °C, 24 °C, 28 °C, or 32 °C. On day 7, the number of individuals in the different stages of development was recorded (larval stages L1, L2, L3, L4, or pupae or adults). Experiments were performed in triplicate. The mean (±standard deviation) percentage of viable individuals on day 7 is presented for the Higgs and University of São Paulo (USP) strains.
Fig. 8
Fig. 8
Temperature effects on oviposition and blood-feeding behavior of A. aegypti (Higgs strain) female mosquitoes. Four groups of ten female mosquitoes each were blood fed on mice, and maintained at 20 °C, 24 °C, 28 °C, or 32 °C for 96 h. The number of eggs laid in the last 24 h during the temperature exposure was recorded (A). Female mosquitoes were individually weighed (3.3 ± 0.4 mg), and divided into groups of 10 mosquitoes each, and the groups were allowed to feed on mice for 10 min at 20 °C, 24 °C, 28 °C, or 32 °C. The number of blood fed mosquitoes (B) and their individual weight after blood meal (C) was recorded. Experiments were performed in triplicate. The boxes represent the range between the 25th and 75th percentiles. The horizontal line in each box represents the mean value, the circles represent outlier values, and * indicates p < 0.01.

References

    1. Rosenthal J.K., Sclar E.D., Kinney P.L., Knowlton K., Crauderueff R., Brandt-Rauf P.W. Links between the built environment, climate and population health: interdisciplinary environmental change research in New York City. Ann Acad Med Singap. 2007;36:834–846. - PubMed
    1. Lai L.W., Cheng W.L. Air quality influenced by urban heat island coupled with synoptic weather patterns. Sci Total Environ. 2009;407:2724–2733. - PubMed
    1. Choi G.Y., Choi J.N., Kwon H.J. The impact of high apparent temperature on the increase of Summertime Disease-related mortality in Seoul: 1991–2000. J Prev Med Public Health. 2005;38:283–290. - PubMed
    1. Johnson D.P., Wilson J.S., Luber G.C. Socioeconomic indicators of heat-related health risk supplemented with remotely sensed data. Int J Health Geogr. 2009;8:57. - PMC - PubMed
    1. Gubler D.J., Meltzer M. Impact of dengue/dengue hemorrhagic fever on the developing world. Adv Virus Res. 1999;53:35–70. - PubMed