Review
. 2015 Jul;36(7):1204-15.
doi: 10.3174/ajnr.A4180. Epub 2014 Dec 18.

Ultra-High-Field MR Neuroimaging

Affiliations
Review

Ultra-High-Field MR Neuroimaging

P Balchandani et al. AJNR Am J Neuroradiol. 2015 Jul.

Abstract

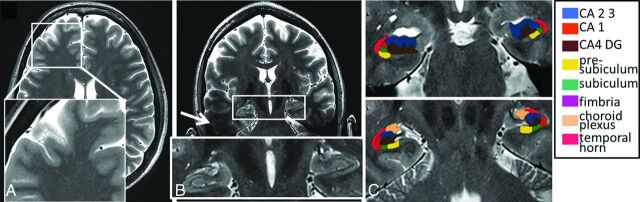
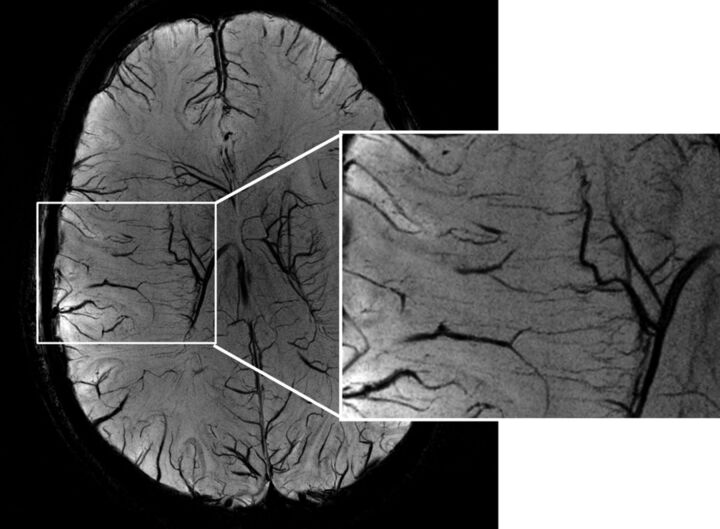
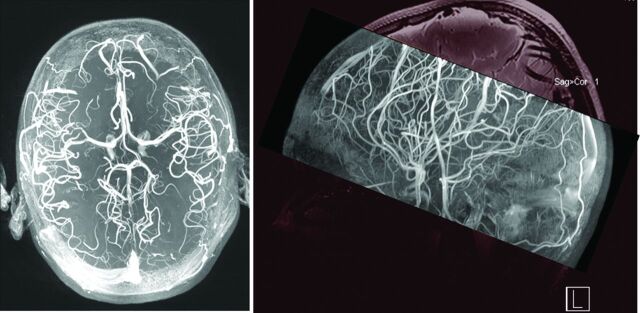
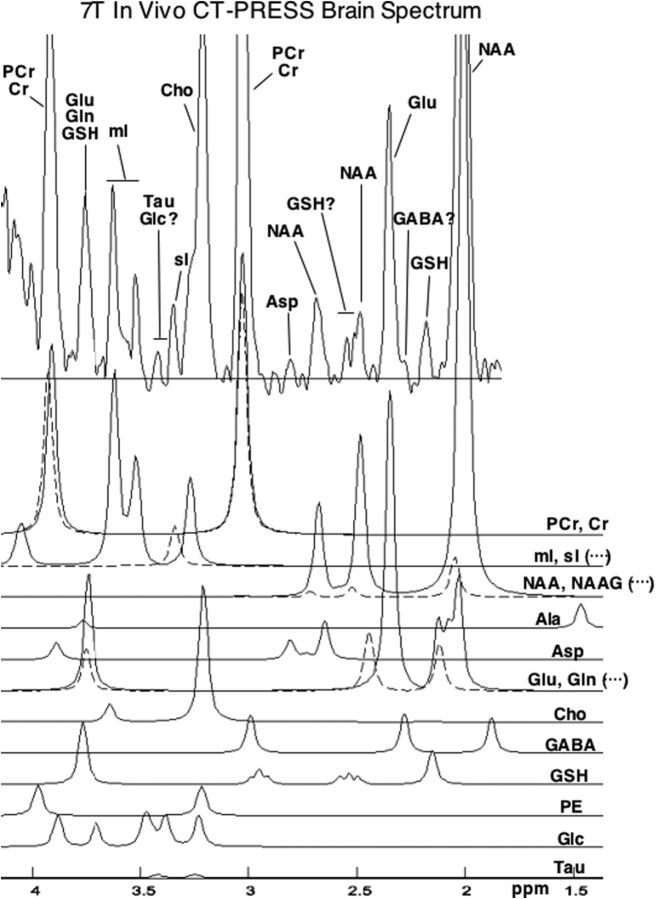
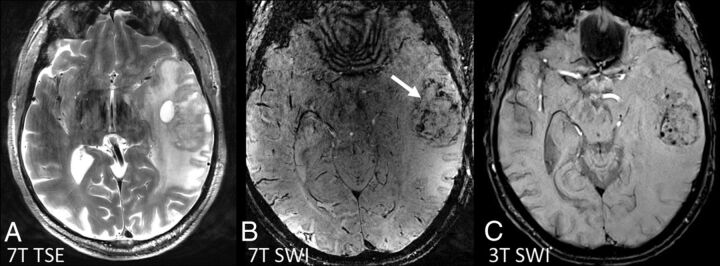
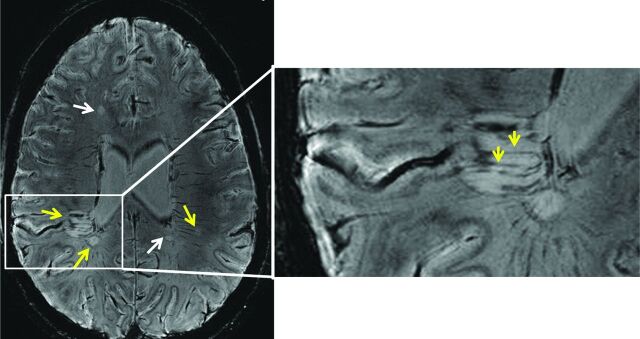
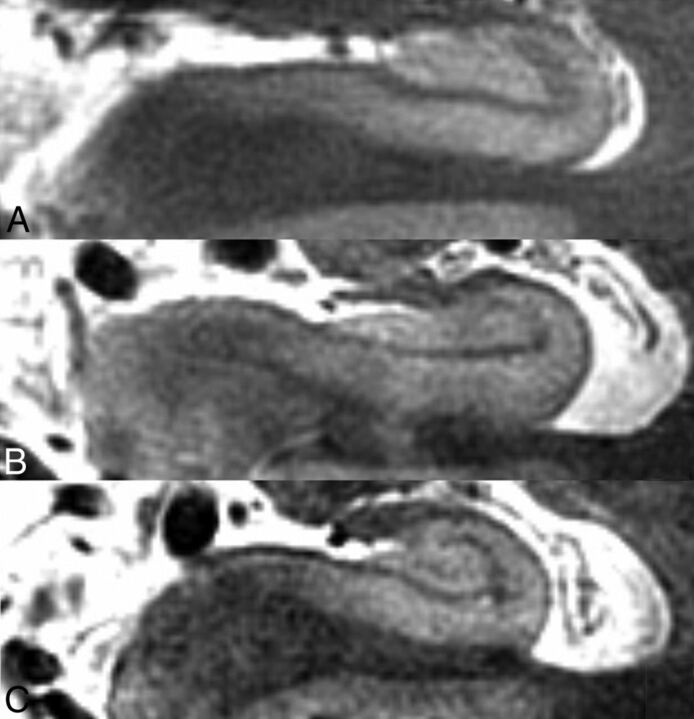
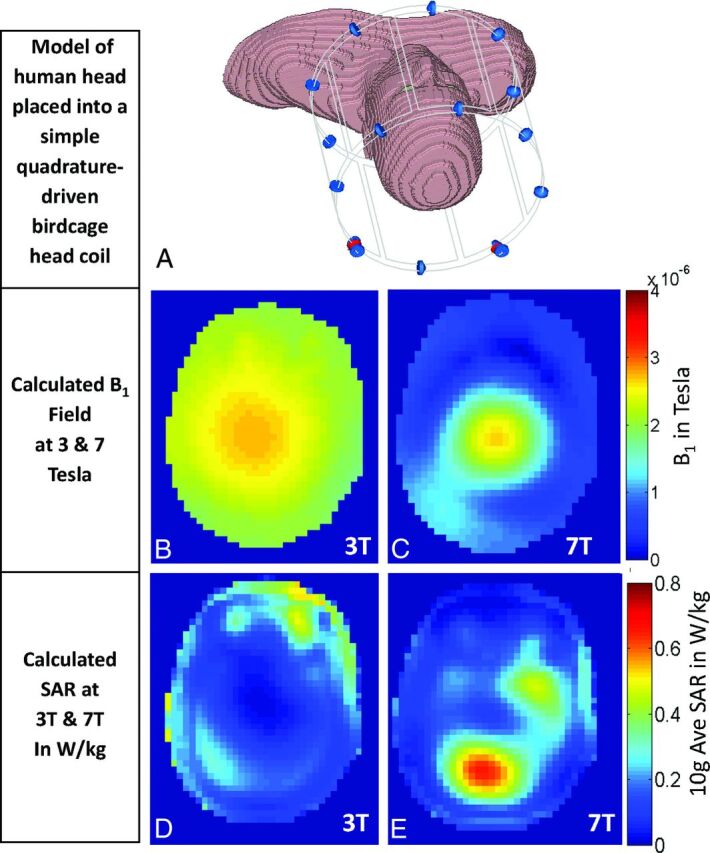
At ultra-high magnetic fields, such as 7T, MR imaging can noninvasively visualize the brain in unprecedented detail and through enhanced contrast mechanisms. The increased SNR and enhanced contrast available at 7T enable higher resolution anatomic and vascular imaging. Greater spectral separation improves detection and characterization of metabolites in spectroscopic imaging. Enhanced blood oxygen level-dependent contrast affords higher resolution functional MR imaging. Ultra-high-field MR imaging also facilitates imaging of nonproton nuclei such as sodium and phosphorus. These improved imaging methods may be applied to detect subtle anatomic, functional, and metabolic abnormalities associated with a wide range of neurologic disorders, including epilepsy, brain tumors, multiple sclerosis, Alzheimer disease, and psychiatric conditions. At 7T, however, physical and hardware limitations cause conventional MR imaging pulse sequences to generate artifacts, requiring specialized pulse sequences and new hardware solutions to maximize the high-field gain in signal and contrast. Practical considerations for ultra-high-field MR imaging include cost, siting, and patient experience.


Figures

Fig 1.
Fig 1.
High-resolution axial (A) and coronal oblique (B) images of the brain obtained at 7T. The 450-μm in-plane resolution enables visualization of the hippocampus in fine detail. C, Effective hippocampal subfield segmentation may be performed on a 7T TSE image. Subfields were manually traced courtesy of Dr Jason Bini on high-resolution coronal TSE images on OsiriX Image Viewing Software (http://www.osirix-viewer.com) by using the segmentation work by Van Leemput et al as a guide. Scanner: whole-body 7T MR imaging (Magnetom; Siemens). RF coil: Nova 32-channel head coil (Nova Medical, Wilmington, Massachusetts). Scan parameters: number of sections = 25, section thickness = 2 mm, FOV = 23 cm, grid size = 512 × 512, resolution = 0.44 × 0.44 × 2 mm3, scanning time = 6 minutes and 30 seconds.
Fig 2.
Fig 2.
MIP of a 7T susceptibility-weighted image of the brain of a healthy volunteer revealing tiny venules in the cortex. Scanner: whole-body 7T MR imaging (Magnetom; Siemens). RF coil: Nova 32-channel head coil. Scan parameters: resolution = 0.2 × 0.2 × 1.5 mm3, MIP thickness = 12 mm over the set of sections, scanning time = 6 minutes and 2 seconds.
Fig 3.
Fig 3.
Time-of-flight angiography performed on a healthy volunteer at 7T. Axial and sagittal MIP of TOF images are shown. Scanner: whole-body 7T MR imaging (Magnetom; Siemens). RF coil: Nova 32-channel head coil. Scan parameters: resolution = 0.26 × 0.26 × 0.4 mm3, scan time = 7 minutes and 56 seconds.
Fig 4.
Fig 4.
In vivo brain spectra acquired on a healthy volunteer by using a CT-PRESS sequence at 7T. Spectrum is courtesy of Drs Dirk Mayer and Daniel Spielman, Stanford University, Stanford, California. Plotted below the in vivo data are simulated spectra of individual metabolites, as generated by the CT-PRESS acquisitions. Metabolites shown are: phosphocreatine (PCr), creatine (Cr), myo-inositol (mI), scyllo-inositol (sI), N-acetylaspartate (NAA), N-acetyl aspartylglutamate (NAAG), alanine (Ala), aspartate (Asp), glutamate (Glu), glutamine (Gln), Choline (Cho), gamma-aminobutyric acid (GABA), glutathione (GSH), phosphoethanolamine (PE), glucose (Glc), taurine (Tau). Scanner: 7T whole-body scanner (MR950; GE Healthcare, Milwaukee, Wisconsin). RF coil: Nova head coil. Scan parameters: resolution = 2 × 2 × 2 cm3; voxel centrally located in the supertentorial brain, scanning time = 5 minutes.
Fig 5.
Fig 5.
Tractography performed by using diffusion imaging at 7T with readout-segmented EPI and parallel imaging. Image courtesy of Dr Robin Heidemann, Max Planck Institute for Human Cognitive and Brain Sciences, Leipzig, Germany. Scanner: whole-body 7T MR imaging (Magnetom; Siemens). RF coil: Nova 24-channel head coil. Scan parameters: b-value of 1000 s/mm2, resolution = 1 × 1 × 1 mm3, 30 diffusion directions, generalized autocalibrating partially parallel acquisition acceleration factor = 3, TE/TR = 60/11,000 ms, scanning time = 75 minutes.
Fig 6.
Fig 6.
Sodium brain image of a healthy volunteer obtained at 7T using a 3D attenuation-adapted projection reconstruction. Images courtesy of Dr Armin Nagel, the German Cancer Research Center, Heidelberg, Germany. Scanner: whole-body 7T MR imaging (Magnetom; Siemens). RF coil: double-resonant (1H = 297.2 MHz; 23Na = 78.6 MHz) quadrature birdcage coil (Rapid Biomed, Rimpar, Germany). Scan parameters: resolution = 2 × 2 × 2 mm3, scanning time = 20 minutes.
Fig 7.
Fig 7.
A, 3T and 7T coronal FSE images obtained for a patient with mesial temporal lobe epilepsy. Subtle left hippocampal abnormalities are visualized in greater detail in the 7T image. B, In a second patient with mesial temporal lobe epilepsy, loss of gray matter in the left hippocampus is detected at 7T (white arrow), after no abnormalities were reported at 3T. Images are courtesy of Drs Michael Zeineh, Manoj Saranathan, and Brian Rutt, Stanford University, Stanford, California. Scanners: whole-body 3T and 7T MR imaging (MR950; GE Healthcare). RF coils: standard 3T head coil (GE Healthcare) and Nova 7T head coil. Scan parameters: section thickness = 2 mm, resolution = 0.22 × 0.22 × 2 mm3, scanning time = 10 minutes.
Fig 8.
Fig 8.
A–C, Images of total sodium content for a patient with a glioblastoma of the mesial frontal lobe. Total sodium signal is elevated in tumor tissue. D–F, Images of relaxation-weighted sodium signal of the same patient. This provides sodium levels from a different tissue compartment and is only elevated in the central portion of the tumor. Images are courtesy of Drs Armin Nagel and Armin Biller, German Cancer Research Center, Heidelberg, Germany. Scanner: whole-body 7T MR imaging (Magnetom; Siemens). RF coil: rapid double-resonant (1H = 297.2 MHz; 23Na = 78.6 MHz) quadrature birdcage coil. Scan parameters: resolution = 2.5 × 2.5 × 2.5 mm3, scanning time = 13 minutes (A–C); resolution = 5.5 × 5.5 × 5.5 mm3, scanning time = 10 minutes (D–F).
Fig 9.
Fig 9.
A, High-resolution TSE image of a left temporal glioblastoma. B, 7T SWI provides improved depiction of intratumoral vessels and hemorrhages (white arrow) compared with SWI at 3T (C). Images are provided by Dr Alexander Radbruch, Heidelberg University Hospital and German Cancer Research Center, Heidelberg, Germany. Scanner: whole-body 7T MR imaging (Magnetom; Siemens). RF coil: Nova 32-channel head coil. Scan parameters: resolution = 0.3 × 0.3 × 2 mm3, scanning time = 4 minutes and 13 seconds (A); resolution = 0.7 × 0.7 × 2.5 mm3, scanning time = 3 minutes and 18 seconds (B); resolution = 0.4 × 0.4 × 0.4 mm3, scanning time = 6 minutes and 17 seconds (C).
Fig 10.
Fig 10.
7T SWI of a patient with MS. MS plaques (white and yellow arrows) and tiny veins within MS plaques (yellow arrows) become visible with the high resolution and enhanced contrast afforded by the 7T scanner. Images courtesy of Professor Siegfried Trattnig and Dr Günther Grabner, Medical University of Vienna, Vienna, Austria. Scanner: whole-body 7T MR imaging (Magnetom; Siemens). RF coil: Nova 32-channel head coil. Scan parameters: SWI sequence: resolution = 0.3 × 0.3 × 1.2 mm3, scanning time = 10 minutes.
Fig 11.
Fig 11.
Left hippocampus imaged at 7T across aged-matched patient populations. Healthy control (A), amnestic mild cognitive impairment (B), and probable Alzheimer disease (C). Images courtesy of Drs Jeffrey Bernstein, Brian Rutt, and Geoffrey Kerchner, Stanford University, Stanford, California. Scanner: whole-body 7T MR imaging (MR950; GE Healthcare). RF coil: Nova 32-channel head coil. Scan parameters: FSE sequence: section orientation = coronal oblique intersecting perpendicular to longitudinal axis of hippocampus, TE/TR = 49/6000 ms, 16 sections, section thickness = 1.5 mm, resolution = 0.22 × 0.22 × 1.5 mm3, scanning time = 13 minutes.
Fig 12.
Fig 12.
Differences between the transmitted B1 fields and the specific absorption rates at 3T and 7T. A, Model of a human head placed in a simple quadrature-driven birdcage head coil. B and C, Simulated transmitted B1 field (B1+) for 3T (B) and 7T (C). At 7T, wave-propagation effects cause more severe variation of the B1 field than is seen at 3T. D and E, Simulated SAR in the head model for 3T and 7T (in Watts per kilogram). SAR simulations show increased RF power deposition and greater spatial heterogeneity at 7T than at 3T. At 7T, one must contend with 2 physical limitations, the greater inhomogeneity in the transmit B1 field and the increased SAR deposition. These simulations were performed by Dr Bei Zhang at the Icahn School of Medicine, Mount Sinai, New York. A commercial finite-difference time domain software, CST Microwave Studio (Computer Simulation Technology, Darmstadt, Germany), was used to simulate electric and magnetic fields within the head for “Donna” in the Computer Simulation Technology virtual family. The B1 map was obtained by using 1W for the input power. The resolution of Donna is 1.875 × 1.875 × 2 mm3.

References

    1. Clow H, Young IR. Britain's brains produce first NMR scans. New Scientist 1978;80:588
    1. Atlas SW. Magnetic Resonance Imaging of the Brain and Spine. Vol. 1. Philadelphia: Lippincott Williams & Wilkins; 2009
    1. Kraff O, Fischer A, Nagel AM, et al. . MRI at 7 Tesla and above: demonstrated and potential capabilities. J Magn Reson Imaging 2015;41:13–33 - PubMed
    1. Duyn JH. The future of ultra-high field MRI and fMRI for study of the human brain. Neuroimage 2012;62:1241–48 - PMC - PubMed
    1. Uğurbil K, Adriany G, Andersen P, et al. . Ultrahigh field magnetic resonance imaging and spectroscopy. Magn Reson Imaging 2003;21:1263–81 - PubMed

Publication types

LinkOut - more resources