. 2014 Dec 18:9:58.
doi: 10.1186/1750-1326-9-58.

Associations between brain microstructures, metabolites, and cognitive deficits during chronic HIV-1 infection of humanized mice

Affiliations

Associations between brain microstructures, metabolites, and cognitive deficits during chronic HIV-1 infection of humanized mice

Michael D Boska et al. Mol Neurodegener. .

Abstract

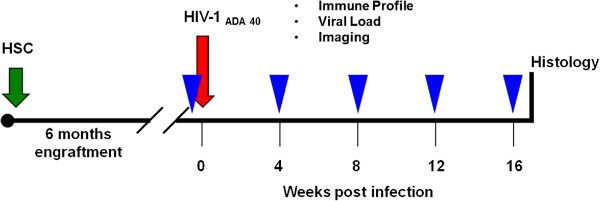
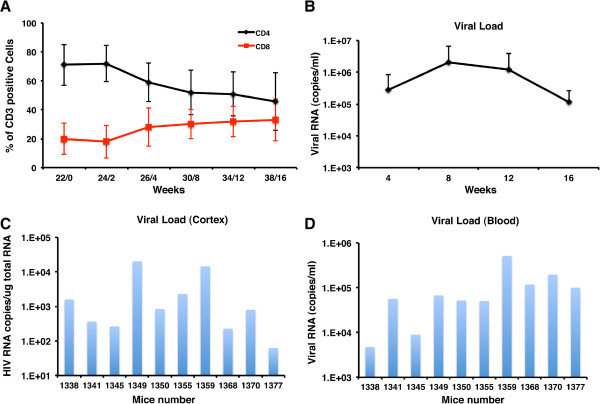
Background: Host-species specificity of the human immunodeficiency virus (HIV) limits pathobiologic, diagnostic and therapeutic research investigations to humans and non-human primates. The emergence of humanized mice as a model for viral infection of the nervous system has overcome such restrictions enabling research for HIV-associated end organ disease including behavioral, cognitive and neuropathologic deficits reflective of neuroAIDS. Chronic HIV-1 infection of NOD/scid-IL-2Rgcnull mice transplanted with human CD34+ hematopoietic stem cells (CD34-NSG) leads to persistent viremia, profound CD4+ T lymphocyte loss and infection of human monocyte-macrophages in the meninges and perivascular spaces. Murine cells are not infected with virus.

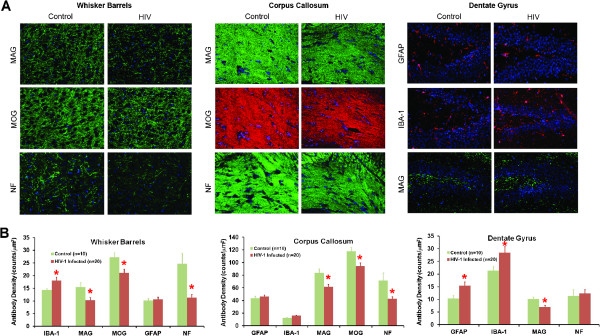
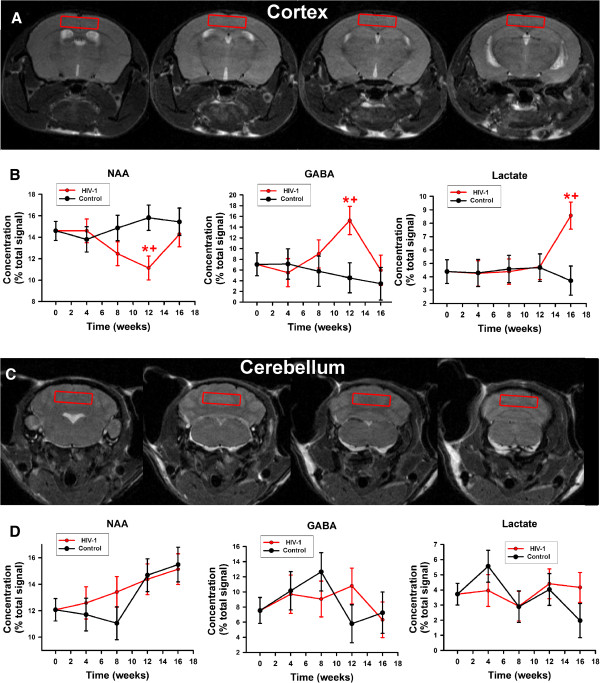
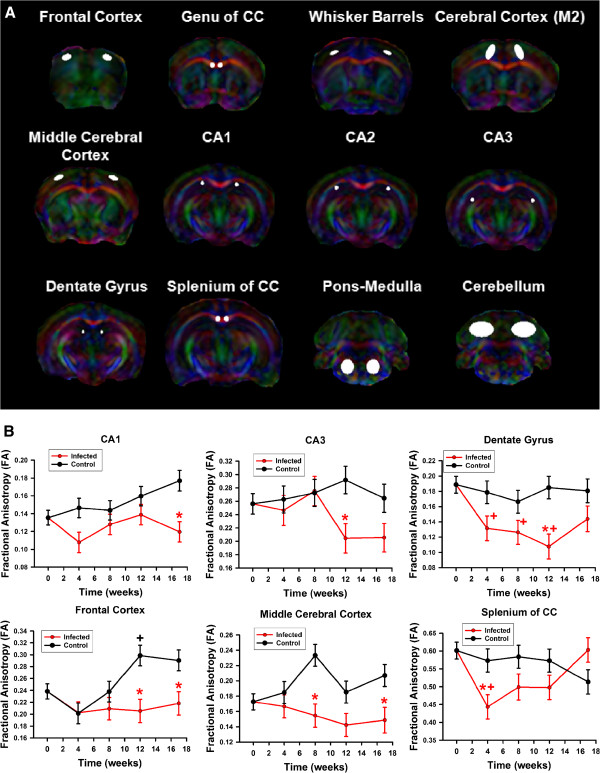
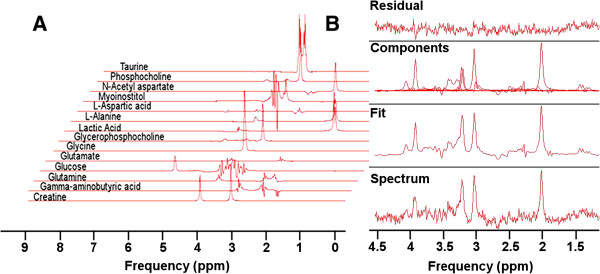
Methods: Changes in mouse behavior were measured, starting at 8 weeks after viral infection. These were recorded coordinate with magnetic resonance spectroscopy metabolites including N-acetylaspartate (NAA), creatine and choline. Diffusion tensor magnetic resonance imaging (DTI) was recorded against multispectral immunohistochemical staining for neuronal markers that included microtubule associated protein-2 (MAP2), neurofilament (NF) and synaptophysin (SYN); for astrocyte glial fibrillary acidic protein (GFAP); and for microglial ionized calcium binding adaptor molecule 1 (Iba-1). Oligodendrocyte numbers and integrity were measured for myelin associated glycoprotein (MAG) and myelin oligodendrocyte glycoprotein (MOG) antigens.

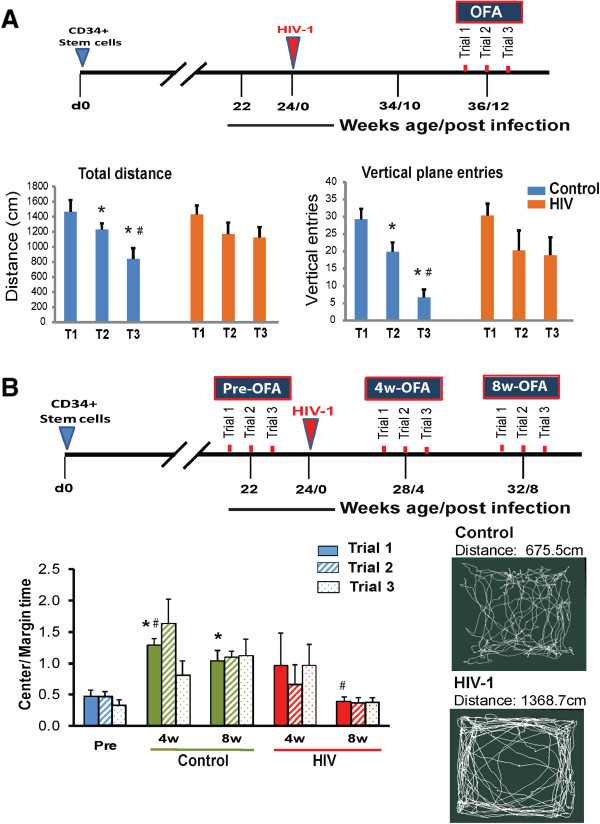
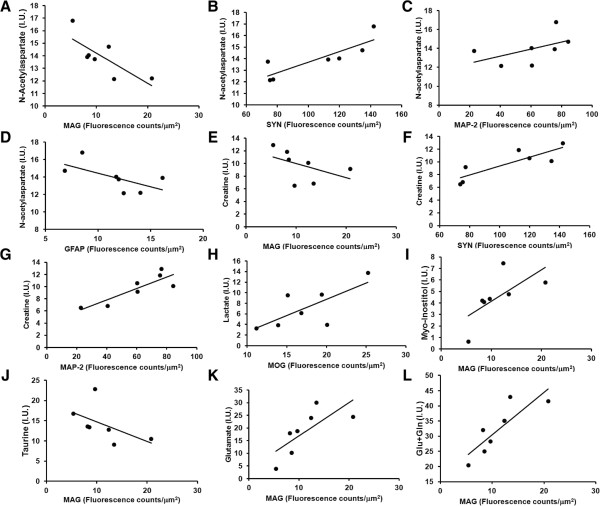
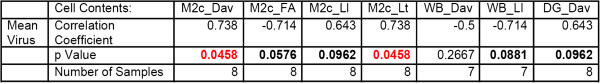
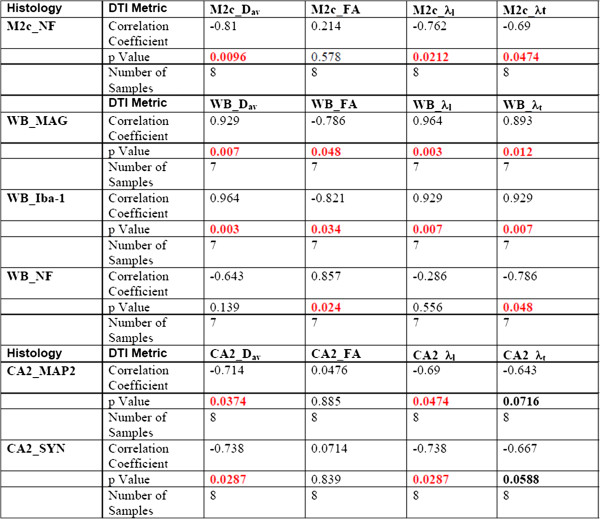
Results: Behavioral abnormalities were readily observed in HIV-1 infected mice. Longitudinal open field activity tests demonstrated lack of habituation indicating potential for memory loss and persistent anxiety in HIV-1 infected mice compared to uninfected controls. End-point NAA and creatine in the cerebral cortex increased with decreased MAG. NAA and glutamate decreased with decreased SYN and MAG. Robust inflammation reflected GFAP and Iba-1 staining intensities. DTI metrics were coordinate with deregulation of NF, Iba-1, MOG and MAG levels in the whisker barrel and MAP2, NF, MAG, MOG and SYN in the corpus callosum.

Conclusions: The findings are consistent with some of the clinical, biochemical and pathobiologic features of human HIV-1 nervous system infections. This model will prove useful towards investigating the mechanisms of HIV-1 induced neuropathology and in developing novel biomarkers and therapeutic strategies for disease.


Figures

Figure 1
Figure 1
Timings for data acquisition in combined blood, neuroimaging, and histology assessments.
Figure 2
Figure 2
VL and immune profiles in HIV-1 infected humanized mice. (A) Flow cytometric analysis of CD4+ and CD8+ T cells in blood of HIV-1 infected mice (n = 10). The x-axis is the weeks following HIV-1 infection. (B) VL dynamics in plasma of replicate blood samples from A. Mice were bled once every 4 weeks starting from 2nd week post-infection. Mean ± SEM are shown in both A and B. (C) Total HIV-1gag RNA levels in the cortex was analyzed by real time RT-PCR. Data is expressed as HIV-1 RNA copies/μg total RNA after normalizing against GAPDH (used as an internal control). (D) For comparison, HIV-1 viral RNA in the peripheral blood at the end point is presented as viral RNA copies/ml.
Figure 3
Figure 3
Effect of HIV-1 infection of humanized CD34-NSG mice on cognition. (A) Schematic diagram is illustrated showing the experimental plan used and results. Three consecutive trials of OFA testing were done at 12–13 weeks after HIV-1 infection. Replicate control mice were injected with PBS for OFA testing at the same time intervals. Mice were tested using 20 min sessions for three consecutive days (3 trials). Mice were bled from sub-mandibular vein under isoflurane inhalation anesthesia for flow cytometry and VL measurements. Total distance travelled measured in the floor plane and vertical entries were measured in the vertical plane. These reflect the exploratory and habituation behavior of the mice in a new environment. Both measurements were reduced by the 2nd and 3rd trials in uninfected controls reflecting habituation. HIV-1 infected animals exhibit continued anxiety. *, p < 0.05 compared to 1st trial and #, p < 0.05 compared to 2nd trial. Values are mean ± SEM. (B) OFA testing was performed longitudinally before infection and 4 and 8 weeks after HIV-1 infection (n = 8 for both control and infected animals). At each time point mice were tested for OFA using 20 min session for three consecutive days (3 trials). Time spent and distance traveled in the center compared to the periphery was automatically measured. The ratios were analyzed to assess anxiety behavior and long term memory of environment. By 8 weeks, control mice showed memory of the environment and reduced anxiety by spending more time in the central bright zone compared to HIV-1 infected mice. * = p < 0.05 compared to trial 1 of pre-infection OFA, and # = p < 0.05 compared to the corresponding trial performed at the same time from controls. Values are mean ± SEM. (B, bottom right) First five minute travel paths with distance travelled for representative control and HIV-1 infected mice from trial 3 of an 8 week time point are shown.
Figure 4
Figure 4
Immunofluorescence staining of neuronal and glial antigens following HIV-1 infection. Paraffin embedded 5 μM brain sections were immunostained with MAP2, SYN, NF, GFAP, MAG and Iba1 antibodies. (A) Representative images captured at 40× magnification from whisker barrel (WB), corpus collosum (CC) and Dentate gyrus, (DG) are shown for those markers significantly deregulated after HIV-1 infection. (B) Density of antigen expression quantified in different brain regions are shown for both HIV-infected and uninfected mice by multispectral imaging. Decreased expression of MAG and NF in WB, CC and DG regions of infected animals compared to uninfected controls. Significant increase in reactive microglia and astroglyosis (GFAP) was observed in DG. Oligodendrocyte associated myelin (MOG) was reduced both in WB and CC. Genu of corpus callosum from infected animals show decreased expression of MAG, MOG and NF in infected mice. Values are mean ± SEM and *denotes p < 0.05.
Figure 5
Figure 5
Metabolite levels (Means ± SEM) expressed as a percentage of total signal acquired over time from 1 H MRS scans of (red) HIV-1 infected (n = 8) and (black) uninfected humanized mouse controls (n = 7). (A) Region selected for spectral acquisition from the cerebral cortex. (B) Selected metabolite levels are measured from the cerebral cortex. Time zero, in infected mice is before infection with subsequent spectra acquired every four weeks to 16 weeks in both infected and control mice. (C) Region selected for acquisition of spectrum from cerebellum. (D) The same metabolites as shown in (B). Time courses of all metabolites are shown in Additional files 3 and 4. *p < 0.05 control versus HIV-1 infected mice, +p < 0.05 vs time zero in control mice, (red “+” symbol) p < 0.05 versus preinfection in infected mice.
Figure 6
Figure 6
Correlations between cortical metabolites at 16 weeks after infection and quantitative multispectral histology. The latter was measured in the M2 region of the cerebral cortex. (A-D) NAA versus MAG, SYN, MAP2 and GFAP respectively are shown. (E-G) Creatine versus MAG, SYN, and MAP2 are illustrated. (H) Lactate versus MOG. (I-L) MAG versus myoinostitol, taurine, glutamate, and glutamate and glutamine, respectively were analyzed in these data sets.
Figure 7
Figure 7
DTI metrics. (A) Brain regions analyzed for DTI metrics. (B) Fractional anisotropy (mean ± SEM) in (top) CA1, CA3, and dentate gyrus (from left to right) and (bottom) frontal cortex, middle cerebral cortex, and splenium of the corpus callosum (from left to right) as shown in (A). (red “*” symbol) p < 0.05 control (n = 7) vs infected (n = 8) mice, +p < 0.05 versus time zero in control mice, (red “+” symbol) p < 0.05 versus pre-infection in HIV-1 infected animals.
Figure 8
Figure 8
Correlations between cortical DTI metrics and mean plasma VL 16 weeks after HIV-1 infection.
Figure 9
Figure 9
Correlations between DTI metrics and histological quantifications in cortex and corpus callosum.
Figure 10
Figure 10
1 H MR spectrum and fit. A: Basis set showing the spectra used to deconvolute the individual components in the in-vivo localized PRESS spectrum. B: In vivo spectrum, fit individual components, and the difference between the fit and the original spectrum (residual) from a single acquisition located in the cerebral cortex.

References

    1. Kraft-Terry SD, Stothert AR, Buch S, Gendelman HE. HIV-1 neuroimmunity in the era of antiretroviral therapy. Neurobiol Dis. 2010;37:542–548. doi: 10.1016/j.nbd.2009.12.015. - DOI - PMC - PubMed
    1. Robertson K, Liner J, Heaton R. Neuropsychological assessment of HIV-infected populations in international settings. Neuropsychol Rev. 2009;19:232–249. doi: 10.1007/s11065-009-9096-z. - DOI - PMC - PubMed
    1. Heaton RK, Franklin DR, Ellis RJ, McCutchan JA, Letendre SL, Leblanc S, Corkran SH, Duarte NA, Clifford DB, Woods SP, Collier AC, Marra CM, Morgello S, Mindt MR, Taylor MJ, Marcotte TD, Atkinson JH, Wolfson T, Gelman BB, McArthur JC, Simpson DM, Abramson I, Gamst A, Fennema-Notestine C, Jernigan TL, Wong J, Grant I, CHARTER Group HIV-associated neurocognitive disorders before and during the era of combination antiretroviral therapy: differences in rates, nature, and predictors. J Neurovirol. 2011;17:3–16. doi: 10.1007/s13365-010-0006-1. - DOI - PMC - PubMed
    1. Pozniak A, Rackstraw S, Deayton J, Barber T, Taylor S, Manji H, Melvin D, Croston M, Nightingale S, Kulasegaram R, Pitkanen M, Winston A. HIV-associated neurocognitive disease: case studies and suggestions for diagnosis and management in different patient sub-groups. Antivir Ther. 2014;19(1):1–13. doi: 10.3851/IMP2563. - DOI - PubMed
    1. Gorantla S, Poluektova L, Gendelman HE. Rodent models for HIV-associated neurocognitive disorders. Trends Neurosci. 2012;35:197–208. doi: 10.1016/j.tins.2011.12.006. - DOI - PMC - PubMed

Publication types

Substances