. 2014 Dec 19:5:5812.
doi: 10.1038/ncomms6812.

Genome-wide analysis of the human p53 transcriptional network unveils a lncRNA tumour suppressor signature

Affiliations

Genome-wide analysis of the human p53 transcriptional network unveils a lncRNA tumour suppressor signature

Yolanda Sánchez et al. Nat Commun. .

Abstract

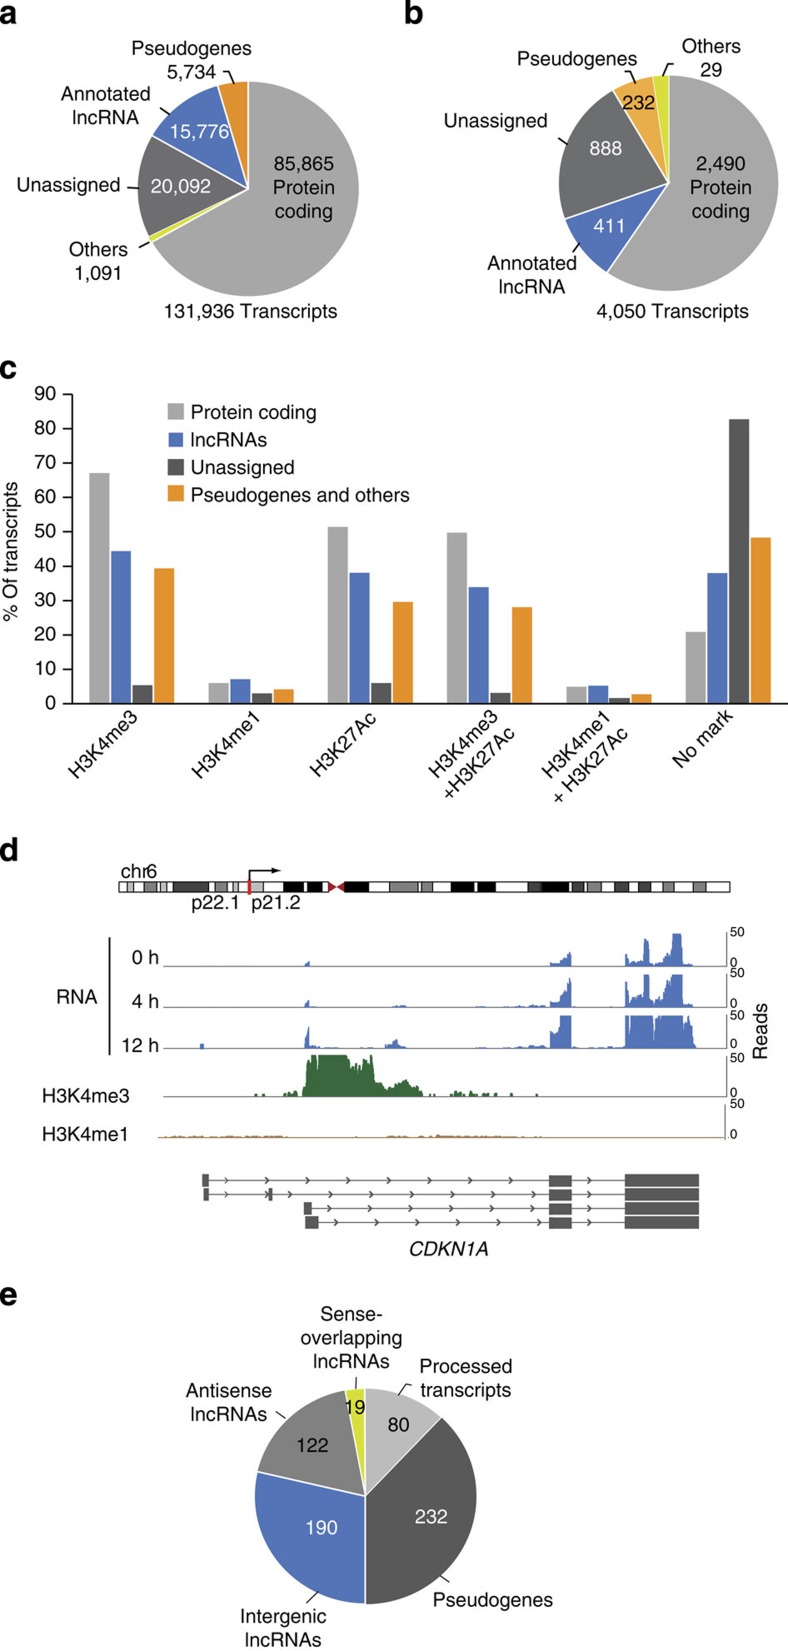
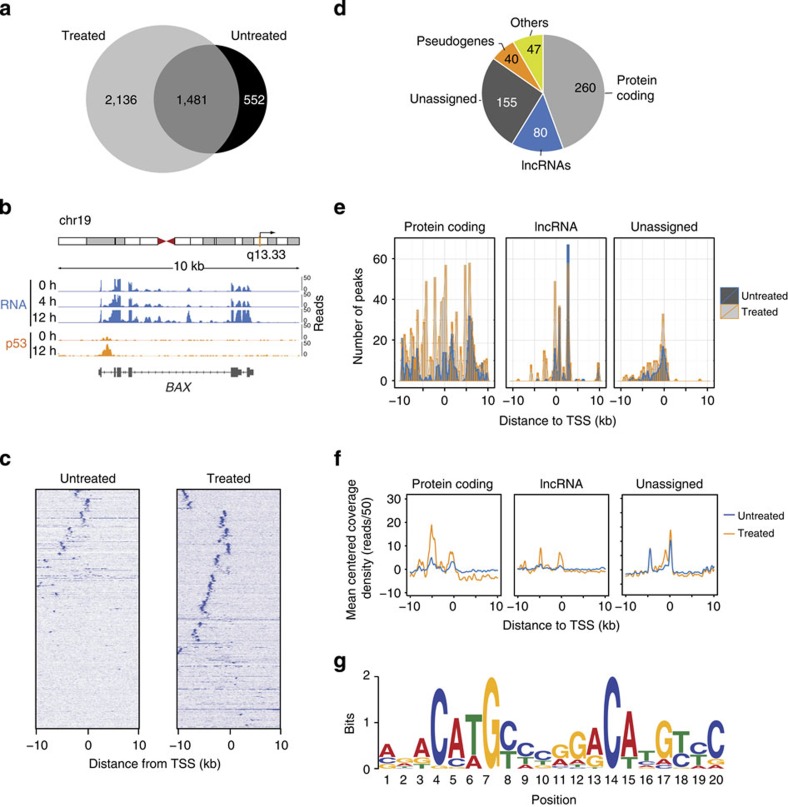
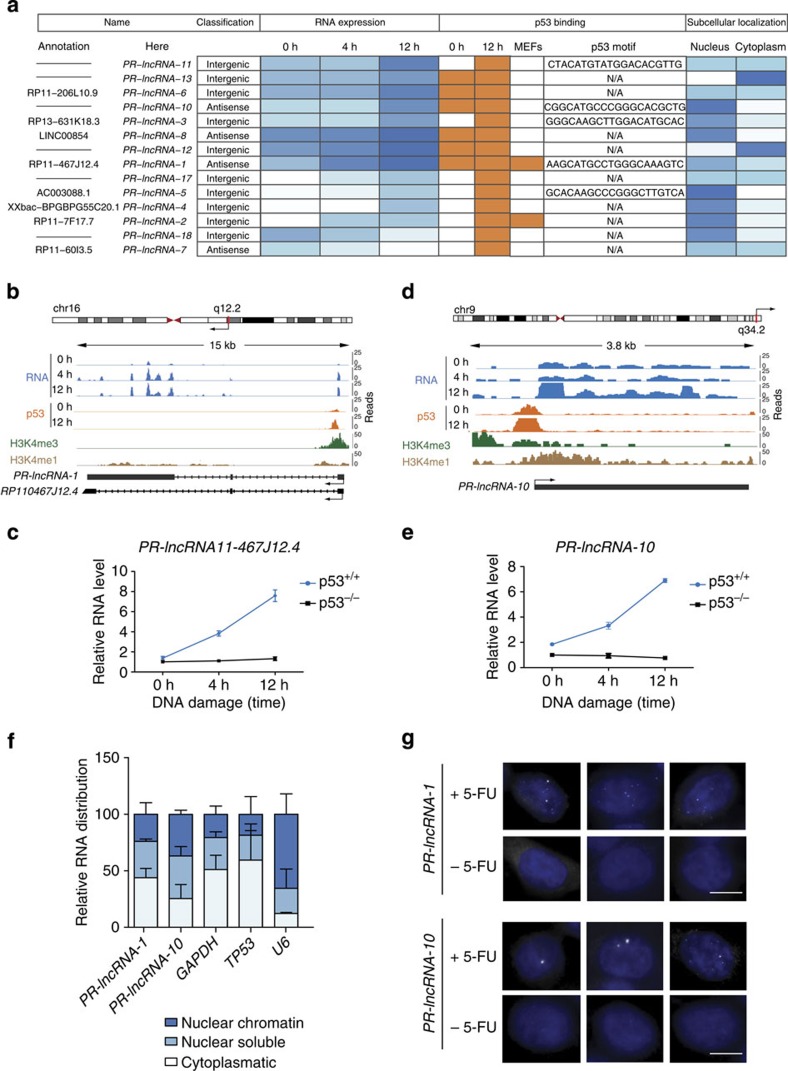
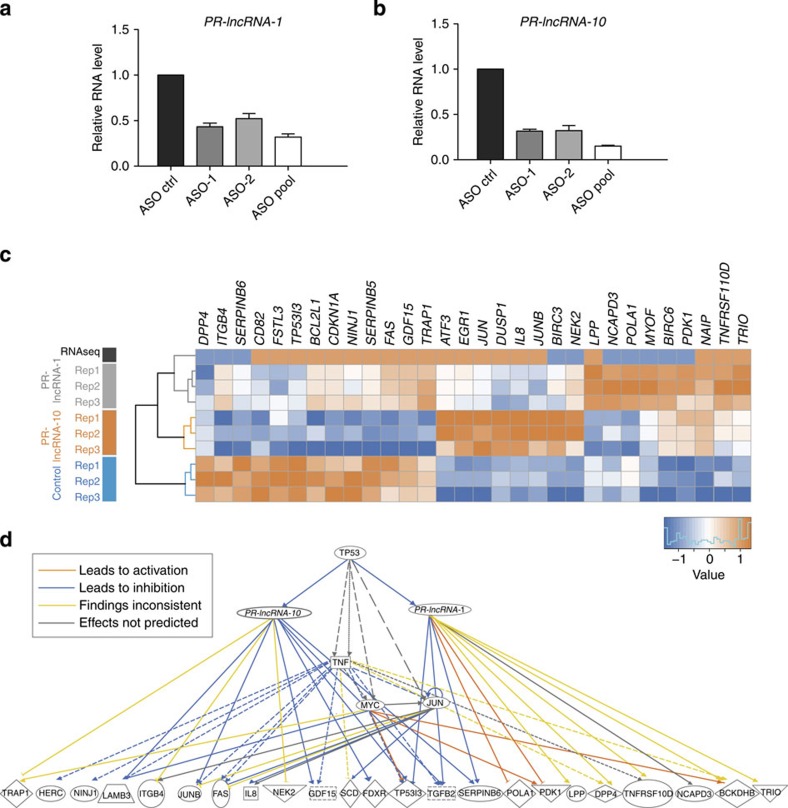
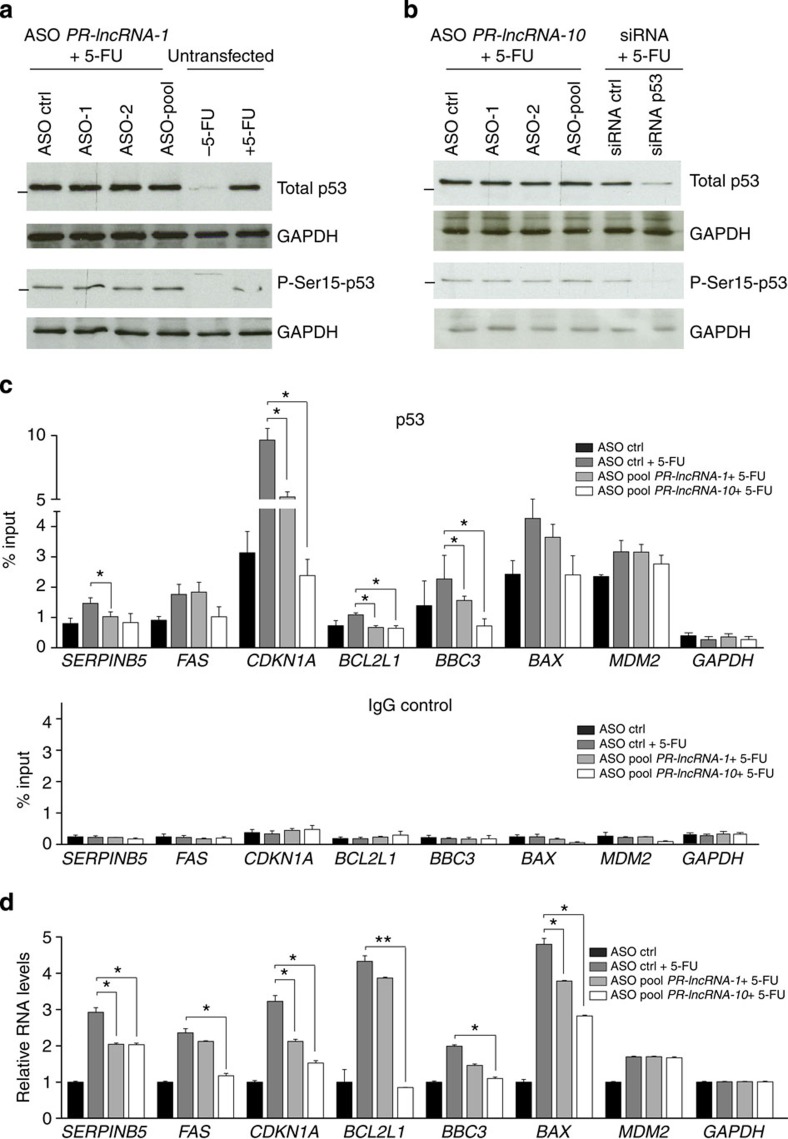
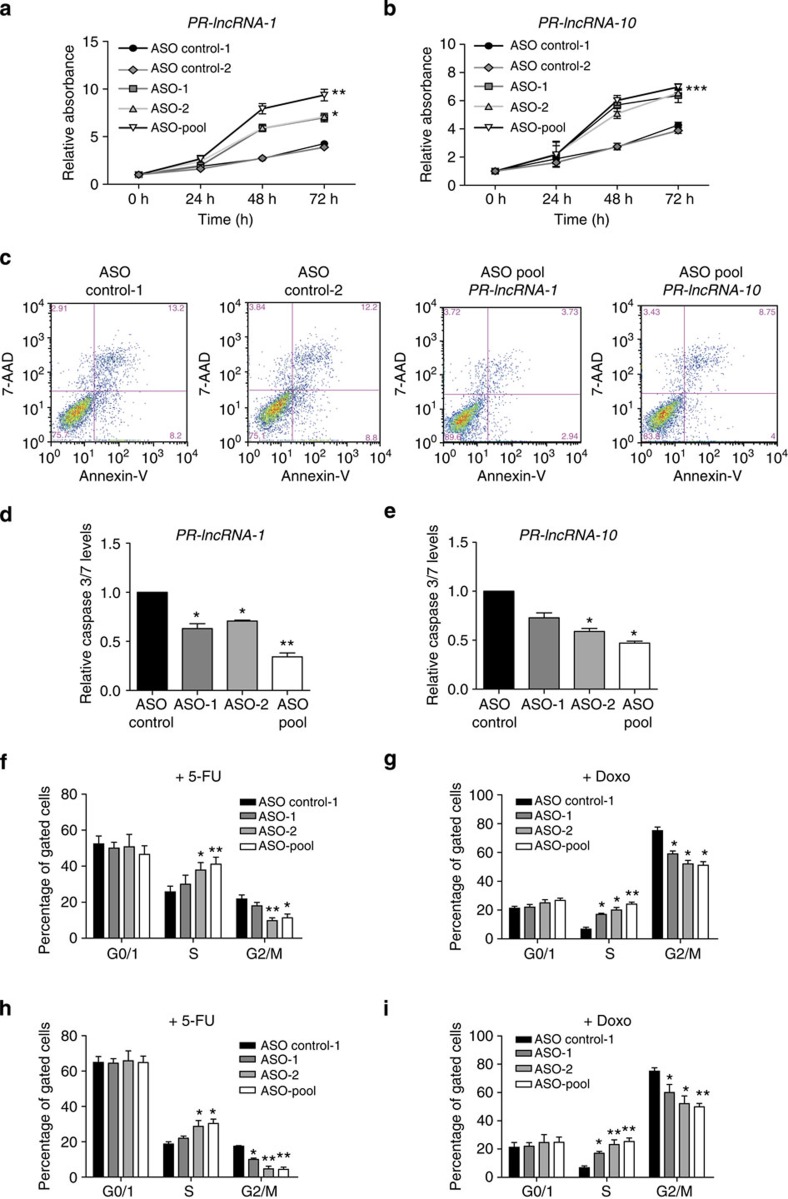
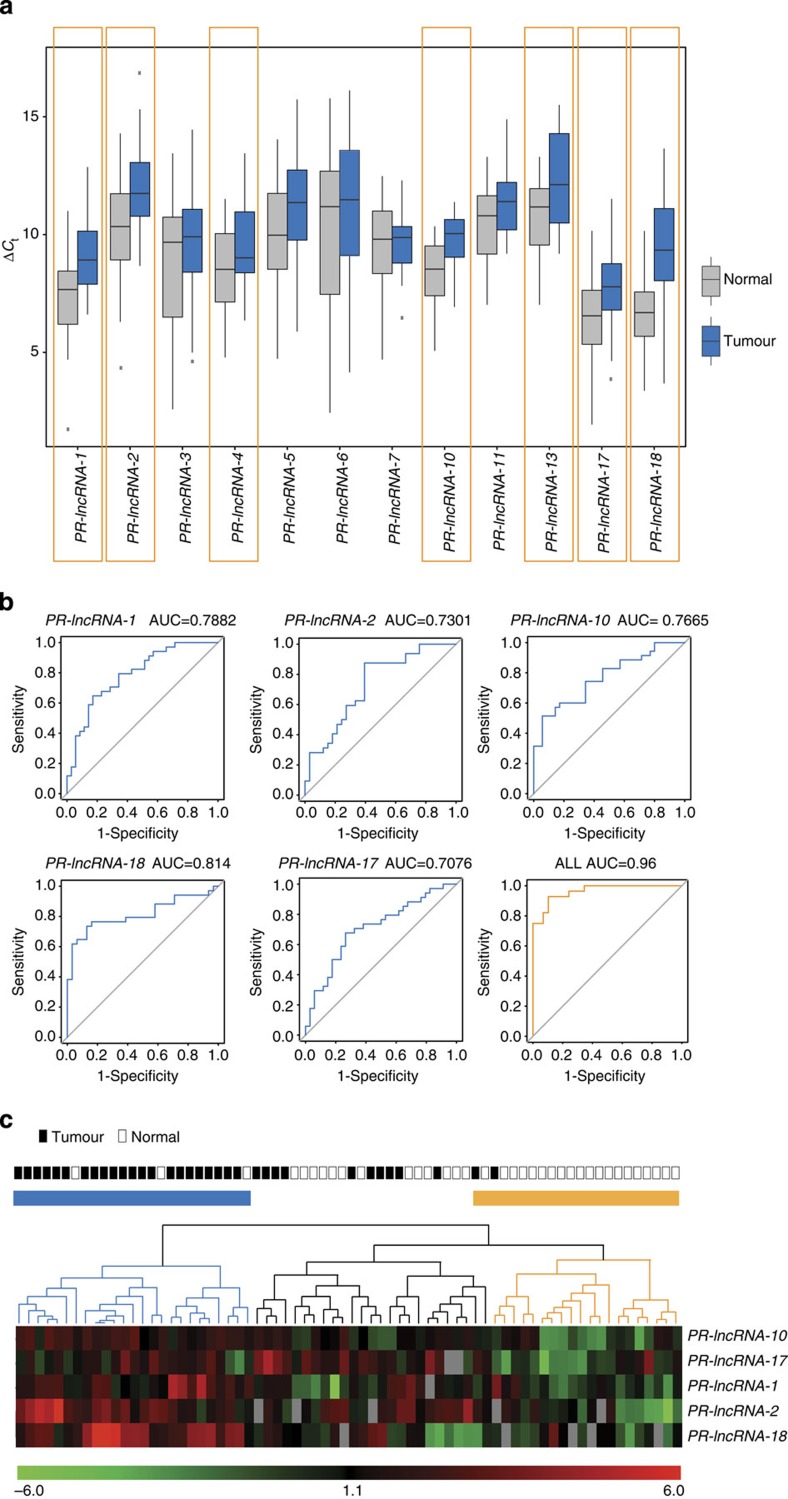
Despite the inarguable relevance of p53 in cancer, genome-wide studies relating endogenous p53 activity to the expression of lncRNAs in human cells are still missing. Here, by integrating RNA-seq with p53 ChIP-seq analyses of a human cancer cell line under DNA damage, we define a high-confidence set of 18 lncRNAs that are p53 transcriptional targets. We demonstrate that two of the p53-regulated lncRNAs are required for the efficient binding of p53 to some of its target genes, modulating the p53 transcriptional network and contributing to apoptosis induction by DNA damage. We also show that the expression of p53-lncRNAs is lowered in colorectal cancer samples, constituting a tumour suppressor signature with high diagnostic power. Thus, p53-regulated lncRNAs establish a positive regulatory feedback loop that enhances p53 tumour suppressor activity. Furthermore, the signature defined by p53-regulated lncRNAs supports their potential use in the clinic as biomarkers and therapeutic targets.


Figures

Figure 1
Figure 1. Genome-wide analysis of the DNA-damage transcriptome of HCT116 cells.
(a) Biotype distribution of all the transcripts identified by RNA-seq analysis generated from HCT116 cells untreated or treated with DNA damage annotated relatively to ENCODE v19. (b) Biotype distribution of the differentially expressed transcripts following DNA-damage treatment with 5-FU for 12 h. (c) Percentage of the transcripts identified by RNA-seq with H3K4me3, H3K4me1 or/and H3K27ac marks at the 5′ position of the defined transcript structures. (d) Schematic representation of the chromosomal location of the CDKN1A gene locus, RNA expression detected by RNA-seq of DNA-damage-treated cells and, H3K4me3 and H3K4me1 levels of HCT116 untreated cells and CDKN1A transcript isoforms as assembled by Cufflinks. (e) Subtypes’ distribution of the lncRNAs found differentially expressed following 5-FU treatment.
Figure 2
Figure 2. Genome-wide analysis of p53 binding.
(a) Total number of p53-binding loci identified by p53 ChIP-seq analysis of HCT116 cells untreated or treated with DNA damage for 12 h. (b) Schematic representation of the chromosomal location of the BAX gene locus, RNA-seq and p53 ChIP-seq signals at 0 and 12 h of 5-FU treatment. (c) Density heatmap of the p53-binding sites across 10 kb from the TSS of genes in untreated and treated HCT116 cells. (d) Distribution by biotypes of genes differentially expressed and bound by p53 upon DNA-damage treatment for 12 h. (e) Number of p53-binding sites and position along 10 kb from the TSS of the nearest gene separated into protein-coding, lncRNA or unassigned gene loci. (f) Distribution of ChIP-seq reads along 10 kb of distance from the nearest TSS of the indicated gene types. (g) p53 consensus motif defined by MEME motif analysis of the sequences of p53 ChIP-seq peaks of genes upregulated by DNA damage (P=4.9E−22, TOMTOM match statistic).
Figure 3
Figure 3. Human lncRNAs directly regulated by p53.
(a) Summary table of lncRNAs directly regulated by p53. Different shades of blue indicate the RNA expression values for each lncRNA under the different conditions of treatment. The presence of p53 binding to the lncRNA loci in HCT116 cells at 0 and 12 h of 5-FU treatment or in MEFs treated with doxorubicin is indicated in orange, and the p53-binding sequence motif obtained by MEME analysis is shown. The relative subcellular localization of the lncRNAs determined by subcellular fractionation followed by qRT–PCR is indicated with colours from white to dark blue according to increasing RNA levels. Values are the average of three biological replicates. (bd) Schematic representation of the chromosomal locations of the PR-lncRNA-1 and PR-lncRNA-10 gene loci. RNA expression (RNA-seq signal), p53, H3K4me3 and H3K4me1 ChIP-seq peaks and transcript structures as assembled by Cufflinks (grey) or annotated by Gencode (black). Validation by qRT–PCR of the PR-lncRNA-1 (c) and PR-lncRNA-10 (e) in an independent experiment with HCT116 p53+/+ and p53−/− untreated or treated with DNA damage for 4 and 12 h. Values represent the mean±s.d. of three biological replicates. (f) Subcellular localization. Percentage of total RNA found in the nuclear fraction bound to chromatin, nuclear soluble and cytoplasmic fractions in the HCT116 p53+/+ cells determined by qRT–PCR. Values represent the mean±s.d. of three biological replicates. (g) RNA fluorescence in situ hybridization of PR-lncRNA-1 and PR-lncRNA-10 in HCT116 p53+/+ cells untreated (−5-FU) or treated (+5-FU) with 5-FU for 12 h. White line indicates 10 μm.
Figure 4
Figure 4. Role of the p53 targets PR-lncRNA-1 and PR-lncRNA-10 in the p53 transcriptional response.
(a,b) HCT116 cells were transfected with a non-targeting ASO (ASO Ctrl) or with two different ASOs (ASO-1 and ASO-2) targeting PR-lncRNA-1 (a) or PR-lncRNA-10 (b), separately or in combination (ASO pool). PR-lncRNA-1 and PR-lncRNA-10 RNA knockdown efficiencies were determined by qRT–PCR. Graphs represent the mean (±s.d.) of three independent experiments. (c) Expression levels of representative genes found differentially expressed in at least one of the microarray analysis (PR-lncRNA-1 or PR-lncRNA-10 depletion) and in HCT116 when treated with 5-FU (RNA-seq analysis). Colours from dark blue to orange indicate increasing RNA levels in each of the experiments. (d) Network connecting p53, PR-lncRNA-1 and PR-lncRNA-10 with some of the commonly regulated genes involved in the DNA-damage response as predicted by Ingenuity Pathway Analysis.
Figure 5
Figure 5. PR-lncRNA-1 and PR-lncRNA-10 are required for the transcriptional activation of some genes by p53.
(a,b) Western blot analysis of total p53 and phospho-p53 (Serine 15) on HCT116 cells transfected with ASOs for PR-lncRNA-1 (a) or PR-lncRNA-10 depletion (b) and treated as indicated. GAPDH is shown as a loading control. MW mark indicates 50 kDa. (c) p53 ChIP of p53 direct target genes regulated by PR-lncRNA-1 and PR-lncRNA-10. ChIP enrichment of p53 and control IgG of the indicated loci in HCT116 cells after the transfection with ASO pool for PR-lncRNA-1, PR-lncRNA-10 or ASO control for 36 h and treatment with 5-FU for 12 h. GAPDH promoter was included as a negative control. The mean±s.d. of three biological replicates, and the significant differences relative to the condition ASO ctrl +5-FU are shown. (d) Relative expression levels of the p53 direct target genes regulated by PR-lncRNA-1 and PR-lncRNA-10 in HCT116 cells treated like in c and determined by qRT–PCR. Values are the average of three biological replicates, and the significant differences relative to the condition ASO ctrl +5-FU are shown. All graphs (c,d) represent the mean (±s.d.) of at least three independent experiments. Significance was determined by two-tailed unpaired t-test. *P<0.05 and **P<0.01.
Figure 6
Figure 6. PR-lncRNA-1 and PR-lncRNA-10 modulate cell proliferation and apoptosis.
(a,b) HCT116 cells were transfected with two separate non-targeting ASOs (Ctrl-1 and Ctrl-2) or with two different ASOs (ASO-1 and ASO-2) targeting PR-lncRNA-1 or PR-lncRNA-10, separately or in combination (ASO pool), and treated with 150 nM DNA-damage Doxo for 12 h. Cell proliferation was measured by MTS assay up to 72 h (a,b). (c) Percentage of apoptotic cells measured by annexinV-7AAD (7-aminoactinomycin D) staining on cells transfected with the indicated ASOs and treated with the 350 μM DNA-damage drug 5-FU for 12 h. (d,e). Apoptosis was determined by quantification of caspase 3/7 levels in cells treated with 5-FU for 12 h and transfected with the indicated ASOs. (fi) Cell cycle phase distribution analysed by propidium iodide staining of cells transfected with ASOs specific for PR-lncRNA-1 (f,g) or PR-lncRNA-10 (h,i) depletion and treated with the indicated drugs for 12 h. All graphs (ai) represent the mean (±s.d.) of at least three independent experiments. Significance was determined by two-tailed unpaired t-test. *P<0.05 and **P<0.01.
Figure 7
Figure 7. p53-regulated lncRNAs constitute a tumour-suppressor signature in colorectal cancer.
(a) Relative expression level of p53-regulated lncRNAs in a cohort of 35 tumour samples compared with the normal peripheral tissue. The highlighted candidates are significantly downregulated in the tumours (P<0.01). (b) ROC analysis of the sensitivity and specificity for the training cohort for the seven significant p53-regulated lncRNAs. Multivariate ROC analysis for the five p53-regulated lncRNAs with AUC values >0.7. (c) Clustering of the expression levels of the p53-regulated lncRNAs with AUC values >0.7. Rows represent lncRNAs and columns represent patients.

References

    1. Beckerman R. & Prives C. Transcriptional regulation by p53. Cold Spring Harb. Perspect. Biol. 2, a000935 (2010). - PMC - PubMed
    1. Menendez D., Inga A. & Resnick M. A. The expanding universe of p53 targets. Nat. Rev. Cancer 9, 724–737 (2009). - PubMed
    1. Dinger M. E. et al.. Long noncoding RNAs in mouse embryonic stem cell pluripotency and differentiation. Genome Res. 18, 1433–1445 (2008). - PMC - PubMed
    1. Khalil A. M. et al.. Many human large intergenic noncoding RNAs associate with chromatin-modifying complexes and affect gene expression. Proc. Natl Acad. Sci. USA 106, 11667–11672 (2009). - PMC - PubMed
    1. Cabili M. N. et al.. Integrative annotation of human large intergenic noncoding RNAs reveals global properties and specific subclasses. Genes Dev. 25, 1915–1927 (2011). - PMC - PubMed

Publication types

MeSH terms

Substances

Associated data