

Estimating the sample mean and standard deviation from the sample size, median, range and/or interquartile range
- PMID: 25524443
- PMCID: PMC4383202
- DOI: 10.1186/1471-2288-14-135
Estimating the sample mean and standard deviation from the sample size, median, range and/or interquartile range
Abstract
Background: In systematic reviews and meta-analysis, researchers often pool the results of the sample mean and standard deviation from a set of similar clinical trials. A number of the trials, however, reported the study using the median, the minimum and maximum values, and/or the first and third quartiles. Hence, in order to combine results, one may have to estimate the sample mean and standard deviation for such trials.
Methods: In this paper, we propose to improve the existing literature in several directions. First, we show that the sample standard deviation estimation in Hozo et al.'s method (BMC Med Res Methodol 5:13, 2005) has some serious limitations and is always less satisfactory in practice. Inspired by this, we propose a new estimation method by incorporating the sample size. Second, we systematically study the sample mean and standard deviation estimation problem under several other interesting settings where the interquartile range is also available for the trials.
Results: We demonstrate the performance of the proposed methods through simulation studies for the three frequently encountered scenarios, respectively. For the first two scenarios, our method greatly improves existing methods and provides a nearly unbiased estimate of the true sample standard deviation for normal data and a slightly biased estimate for skewed data. For the third scenario, our method still performs very well for both normal data and skewed data. Furthermore, we compare the estimators of the sample mean and standard deviation under all three scenarios and present some suggestions on which scenario is preferred in real-world applications.
Conclusions: In this paper, we discuss different approximation methods in the estimation of the sample mean and standard deviation and propose some new estimation methods to improve the existing literature. We conclude our work with a summary table (an Excel spread sheet including all formulas) that serves as a comprehensive guidance for performing meta-analysis in different situations.
Figures
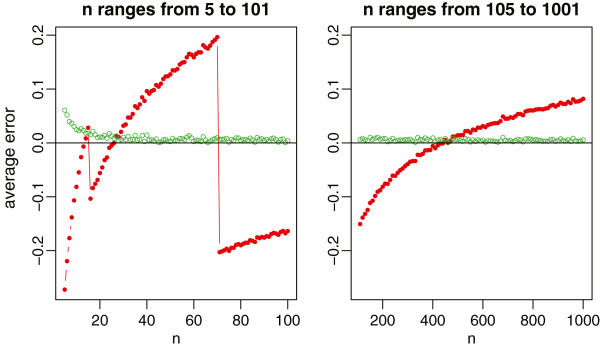
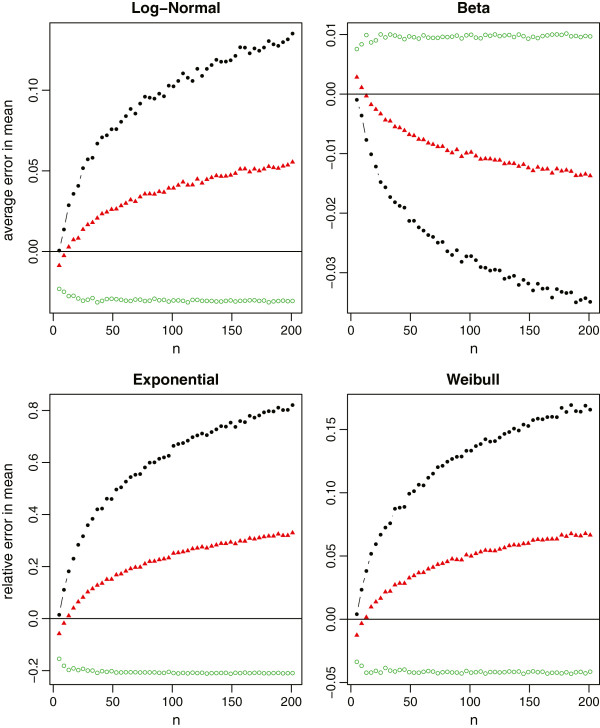
 , the red solid triangles represent the method under scenario
 , and the green empty circles represent the method under scenario
 .
.
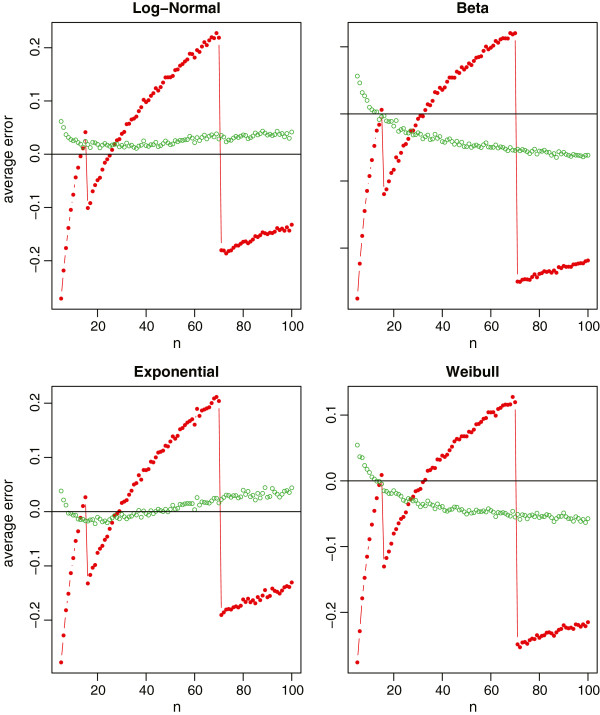
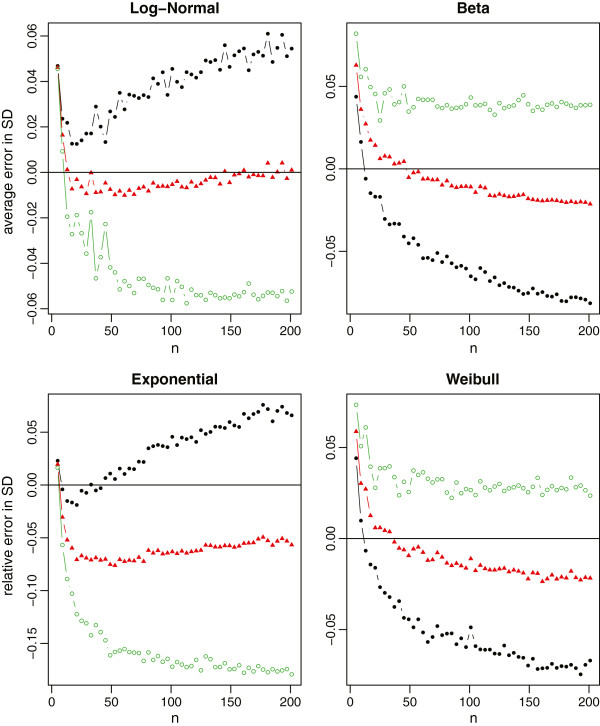
 , the red lines with solid triangles represent the method under scenario
 , and the green lines with empty circles represent the method under scenario
 .
.
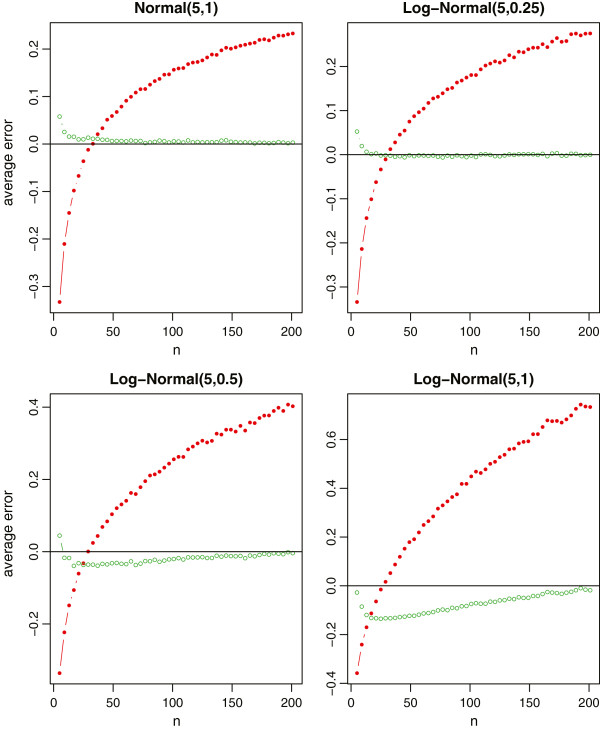
 , the red lines with solid triangles represent the method under scenario
 , and the green lines with empty circles represent the method under scenario
 .
.References
-
- Triola M. F. Elementary Statistics, 11th Ed. 2009.
-
- Hogg RV, Craig AT. Introduction to Mathematical Statistics. Maxwell: Macmillan Canada; 1995.
Pre-publication history
-
- The pre-publication history for this paper can be accessed here: http://www.biomedcentral.com/1471-2288/14/135/prepub
Publication types
MeSH terms
LinkOut - more resources
Full Text Sources
Other Literature Sources
Medical
Miscellaneous
