

Associations between pQCT-based fat and muscle area and density and DXA-based total and leg soft tissue mass in healthy women and men
- PMID: 25524966
- PMCID: PMC4433754
Associations between pQCT-based fat and muscle area and density and DXA-based total and leg soft tissue mass in healthy women and men
Abstract
Peripheral Quantitative Computed Tomography (pQCT) can be used for muscle and fat area and density assessments. These may independently influence muscle and fat mass measurements from Dual Energy X-ray Absorptiometry (DXA).
Objective: To determine associations between pQCT-derived soft tissue density and area measures and DXA-derived soft tissue mass.
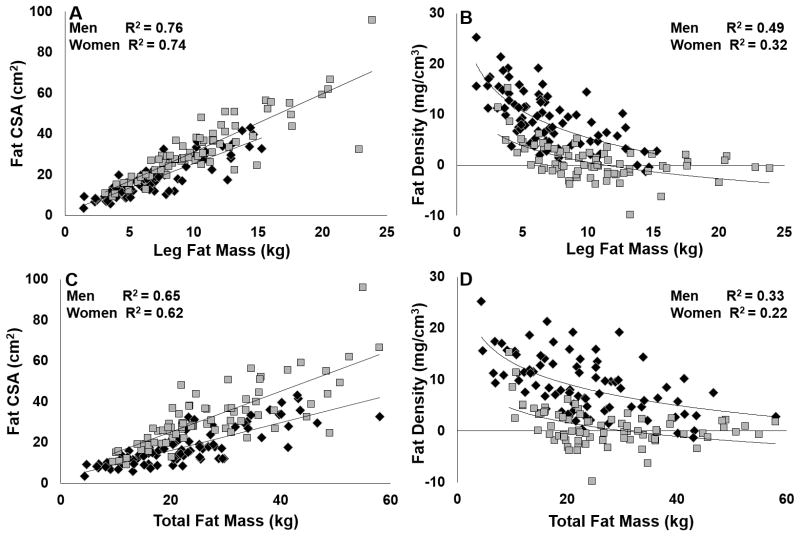
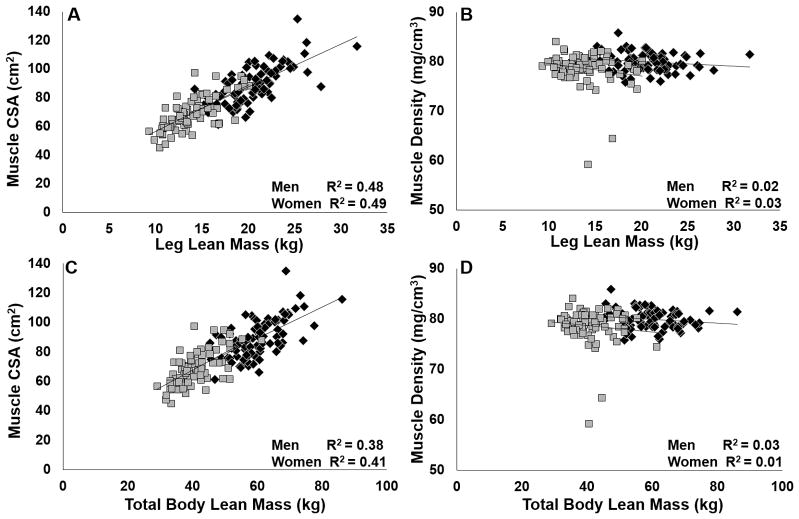
Methods: Linear regression models were developed based on BMI and calf fat and muscle cross-sectional area (FCSA and MCSA) and density measured by pQCT in healthy women (n=76) and men (n=82) aged 20-59 years. Independent variables for these models were leg and total bone-free lean mass (BFLM) and fat mass (FM) measured by DXA.
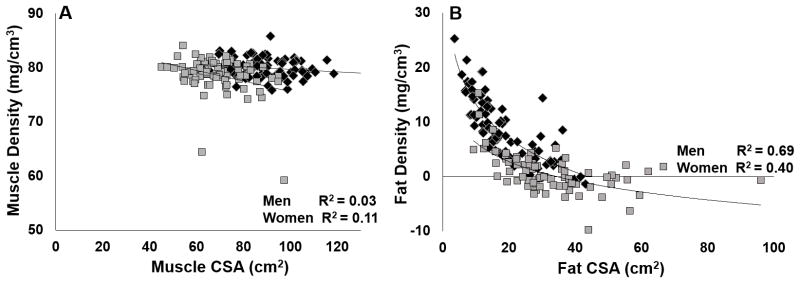
Results: Sex differences (p<0.01) were found in both muscle (Mean±SE: Women: 78.6±0.4; Men: 79.9±0.2 mg/cm(3)) and fat (Women: 0.8±0.4 Men: 9.1±0.6 mg/cm(3)) density. BMI, fat density, and age (R(2)=0.86, p<0.01) best accounted for the variability in total FM. FCSA, BMI, and fat density explained the variance in leg FM (R(2)=0.87, p<0.01). MCSA and muscle density explained the variance in total (R(2)=0.65, p<0.01) and leg BFLM (R(2)=0.70, p<0.01).
Conclusion: Calf muscle and fat area and density independently predict lean and fat tissue mass.
Figures
References
-
- Ferretti JL. Perspectives of pQCT technology associated to biomechanical studies in skeletal research employing rat models. Bone. 1995;17:353S–64S. - PubMed
-
- Gasser JA. Assessing bone quantity by pQCT. Bone. 1995;17:145S–54S. - PubMed
-
- Grampp S, Lang P, Jergas M, Gluer CC, Mathur A, Engelke K, et al. Assessment of the skeletal status by peripheral quantitative computed tomography of the forearm: short-term precision in vivo and comparison to dual X-ray absorptiometry. J Bone Miner Res. 1995;10:1566–76. - PubMed
-
- Louis O, Willnecker J, Soykens S, Van den Winkel P, Osteaux M. Cortical thickness assessed by peripheral quantitative computed tomography: accuracy evaluated on radius specimens. Osteoporos Int. 1995;5:446–9. - PubMed
-
- Coupaud S, Jack LP, Hunt KJ, Allan DB. Muscle and bone adaptations after treadmill training in incomplete Spinal Cord Injury: a case study using peripheral Quantitative Computed Tomography. J Musculoskelet Neuronal Interact. 2009;9:288–97. - PubMed