

The composition of the gut microbiota shapes the colon mucus barrier
- PMID: 25525071
- PMCID: PMC4328744
- DOI: 10.15252/embr.201439263
The composition of the gut microbiota shapes the colon mucus barrier
Abstract
Two C57BL/6 mice colonies maintained in two rooms of the same specific pathogen-free (SPF) facility were found to have different gut microbiota and a mucus phenotype that was specific for each colony. The thickness and growth of the colon mucus were similar in the two colonies. However, one colony had mucus that was impenetrable to bacteria or beads the size of bacteria-which is comparable to what we observed in free-living wild mice-whereas the other colony had an inner mucus layer penetrable to bacteria and beads. The different properties of the mucus depended on the microbiota, as they were transmissible by transfer of caecal microbiota to germ-free mice. Mice with an impenetrable mucus layer had increased amounts of Erysipelotrichi, whereas mice with a penetrable mucus layer had higher levels of Proteobacteria and TM7 bacteria in the distal colon mucus. Thus, our study shows that bacteria and their community structure affect mucus barrier properties in ways that can have implications for health and disease. It also highlights that genetically identical animals housed in the same facility can have rather distinct microbiotas and barrier structures.
Keywords: Bacteria; Colon; Intestine; MUC2; Mucus.
© 2014 The Authors. Published under the terms of the CC BY NC ND 4.0 license.
Figures
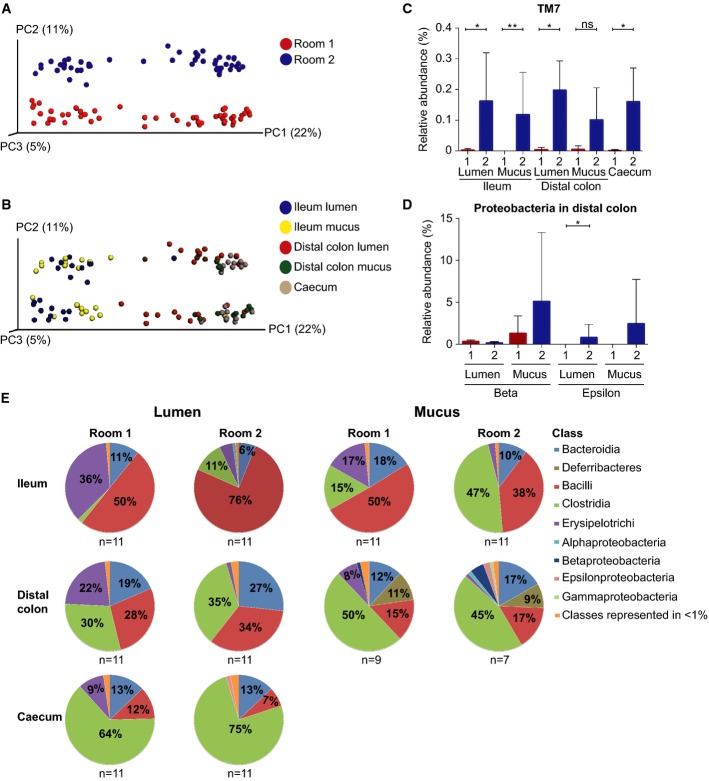
Unweighted UniFrac-based PCoA plot of gut microbial communities from mice in Room 1 (red) and Room 2 (blue) at all intestinal locations.
Unweighted UniFrac-based PCoA plot of mice gut microbial communities from both rooms at different gut segments; ileum lumen (blue), ileum mucus (yellow), distal colon lumen (red), distal colon mucus (green) and caecum (brown) (data as in A).
The relative abundance (%) of the phylum TM7 in ileum lumen Room 1 (n = 11) and Room 2 (n = 11), ileum mucus Room 1 (n = 11) and Room 2 (n = 11), distal colon lumen Room 1 (n = 11) and Room 2 (n = 11), distal colon mucus Room 1 (n = 9) and Room 2 (n = 7), and caecum Room 1 (n = 11) and Room 2 (n = 11).
The relative abundance (%) of the phylum Proteobacteria (beta and epsilon) in distal colon lumen and mucus in Room 1 (n = 11 in lumen and n = 9 in mucus) and Room 2 (n = 11 in lumen and n = 7 in mucus).
Class level microbiota composition in mice from Room 1 and Room 2. The mean relative abundance (%) of the most abundant bacterial classes in ileum lumen Room 1 (n = 11) and Room 2 (n = 11), ileum mucus Room 1 (n = 11) and Room 2 (n = 11), distal colon lumen Room 1 (n = 11) and Room 2 (n = 11), distal colon mucus Room 1 (n = 9) and Room 2 (n = 7), and caecum Room 1 (n = 11) and Room 2 (n = 11). Classes represented as less than 1%: Other, DA052, Actinobacteria, Coriobacteriia, Cytophagia, Flavobacteriia, Sphingobacteriia, (Saprospirae), 4C0d-2, Chloroplast, Deferribacteres, ZB2, Alphaproteobacteria, Betaproteobacteria, Epsilonproteobacteria, Deltaproteobacteria, Gammaproteobacteria, TM7-3, Mollicutes, Verrucomicrobiae.
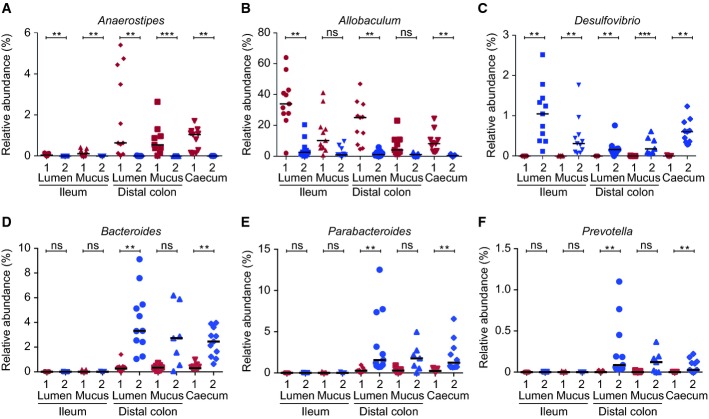
The relative abundance (%) of the genera Anaerostipes (A), Allobaculum (B), Desulfovibrio (C), Bacteroides (D), Parabacteroides (E) and Prevotella (F) in ileum lumen Room 1 (n = 11) and Room 2 (n = 11), ileum mucus Room 1 (n = 11) and Room 2 (n = 11), distal colon lumen Room 1 (n = 11) and Room 2 (n = 11), distal colon mucus Room 1 (n = 9) and Room 2 (n = 7), and caecum Room 1 (n = 11) and Room 2 (n = 11). Data are presented as mean ± SD. Wilcoxon's rank-sum test was conducted to compare over- or under-representation of the different genera. To correct for multiple testing, the P-values were converted to false discovery rate values (Q-values). *P < 0.001, Q < 0.001, **P < 0.001, Q < 0.01, ***P < 0.01, Q < 0.05.
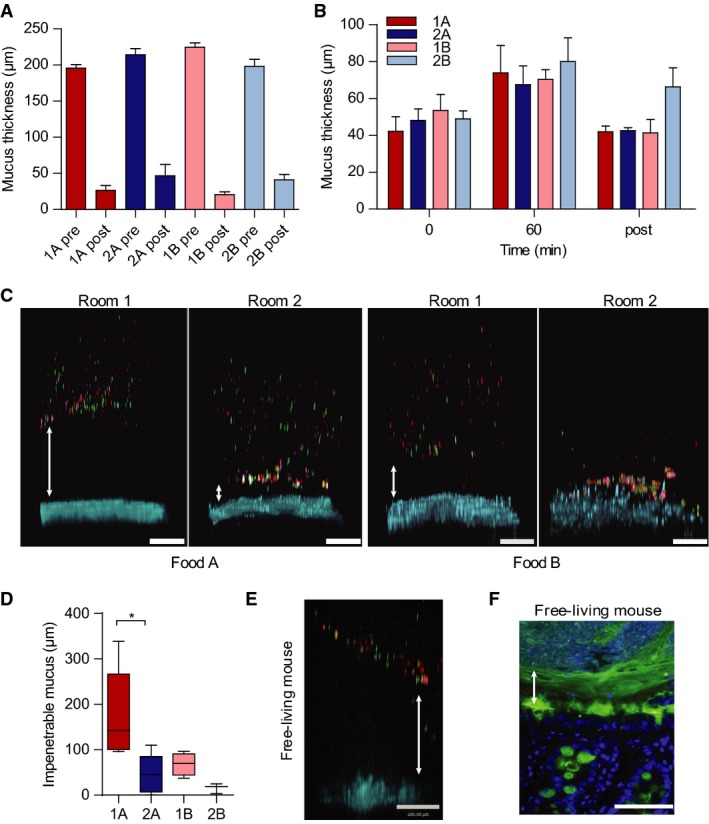
Mucus thickness on explants from distal small intestine (pre) and mucus remaining after aspiration (post) in the different rooms (Room 1 and 2) with the different foods (Food A and Food B). Data are presented as mean ± SEM (n = 3).
Mucus thickness measured during one hour on distal colon explants from mice in the two rooms (Room 1 and 2) with different foods (Food A and Food B). The mucus not attached to the epithelium was removed after 60 min and the attached mucus was measured (post). Data are presented as mean ± SEM (n = 3).
Penetrability of beads (red 0.5 μm, purple 1 μm, green 2 μm) in mucus on explants from mice housed in Room 1 or Room 2 with either Food A or Food B. The epithelium is stained by Calcein violet (blue). Double arrows indicate impenetrable mucus. Scale bar is 100 μm.
The impenetrable mucus as the mean distance of the 20 most penetrable beads shows a significant difference between the mice in the two rooms with Food A. Data are presented as boxplots with median and min–max whiskers. Mann–Whitney U-tests were performed to compare groups (Room 1 and 2) on each food (Food A: n = 5, Food B: n = 3–4, *P = 0.032).
Mucus penetrability as in (C) on explants from free-living mice. Double arrow indicates impenetrable mucus. Scale bar is 100 μm.
Immunostaining for Muc2 (green) of distal colon sections from free-living mice with Hoechst counterstain (blue). Double arrow indicates inner mucus layer without bacteria (visualized by DNA stain). Scale bar is 50 μm.
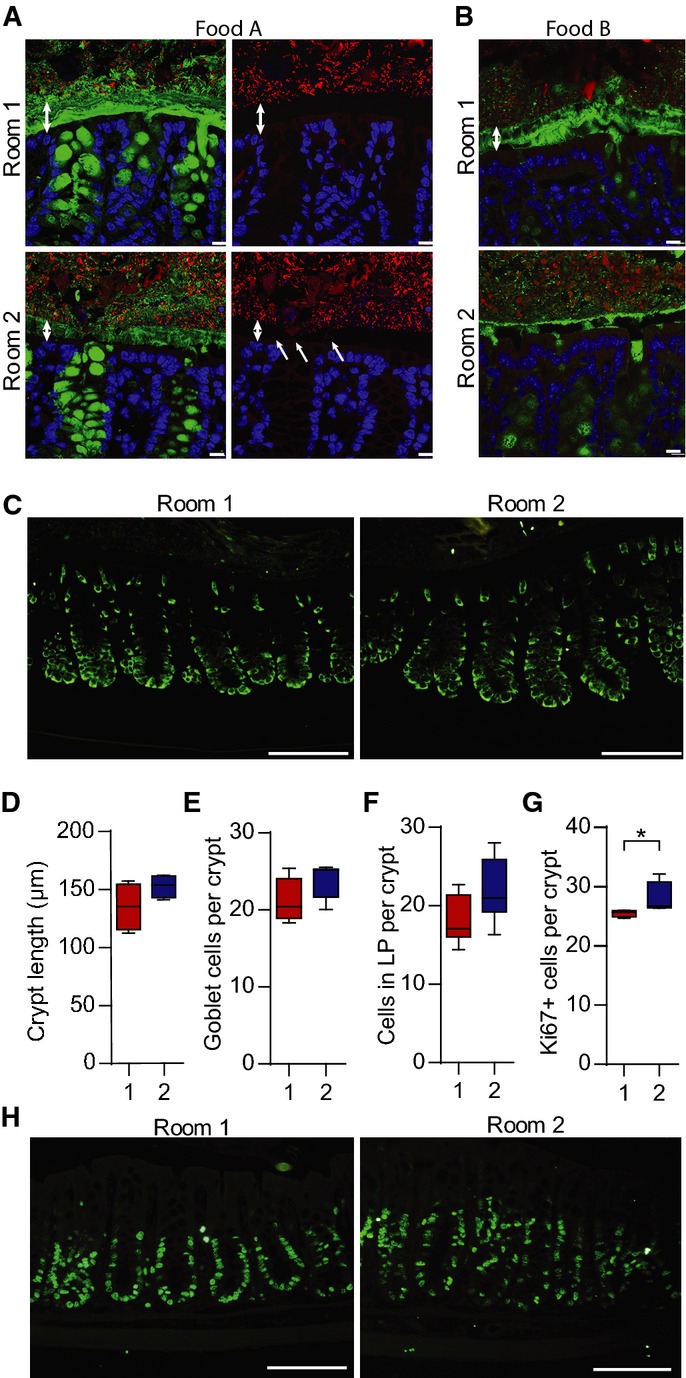
Immunostaining of colon sections from mice in the two rooms with Food A (A) or Food B (B) using Anti-MUC2C3 (green) and FISH with a general bacterial 16S rRNA gene probe to detect bacteria (red) counterstained with Hoechst (blue). Double arrows mark the inner mucus layer that separates bacteria from the epithelium. Bacteria are found within the inner mucus layer (indicated by arrows) in mice housed in Room 2. Scale bar is 10 μm.
Immunostaining of the Muc2 precursor before it gets O-glycosylated using the anti-apoMuc2 antiserum on mice from both rooms fed Food A. Scale bar is 100 μm.
The crypt length was measured in distal colon on sections from mice in the two rooms on Food A (n = 4)
The number of goblet cells per crypt was counted in distal colon of mice in the two rooms on Food A (n = 10).
The number of cells in lamina propria between two crypts, as shown in Supplementary Fig S7, was counted in sections from mice in the two rooms on Food A (n = 10).
The number of Ki67-positive cells per crypt was significantly different in distal colon of mice housed in Room 1 and Room 2 on Food A. Comparison of groups was performed using the Mann–Whitney U-test (n = 4, *P = 0.029).
Ki67 immunostaining (green) on colonic sections from mice in Room 1 or Room 2 on Food A. Scale bars are 100μm.
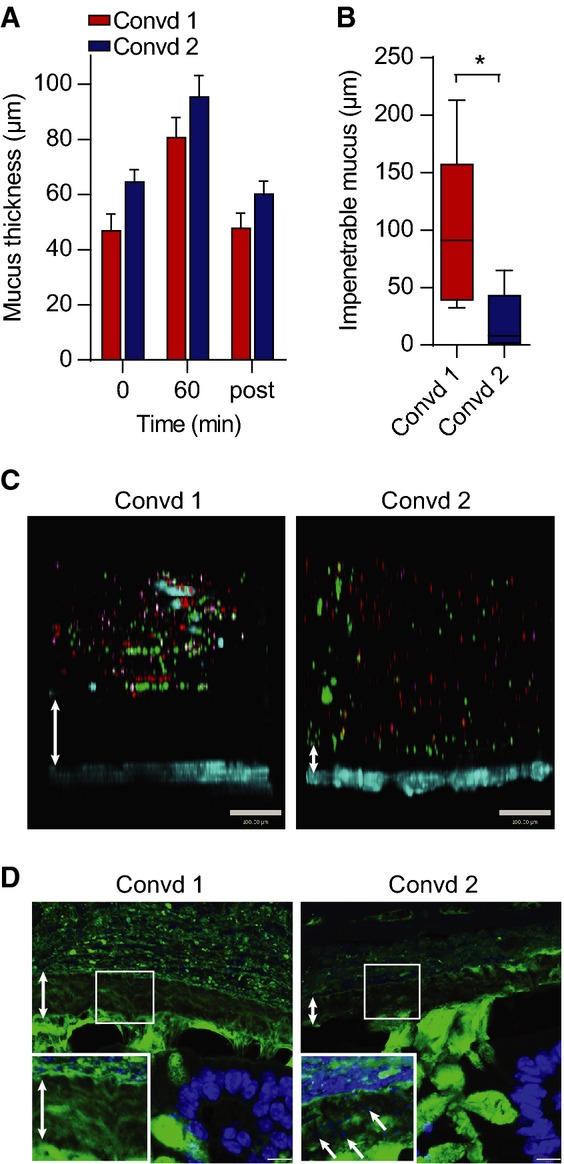
Mucus thickness measured during 1 h on distal colon explants from mice colonized with flora from animals in Room 1 (Convd 1) or with flora from mice in Room 2 (Convd 2). Mucus not attached to the epithelium was removed after 60 min, and the attached mucus was measured (post). Data are presented as mean ± SEM (n = 4–5).
Penetrability of beads in mucus on explants from mice colonized with flora from Room 1 (Convd 1) or Room 2 (Convd 2) presented as impenetrable mucus (distance to 20 most penetrating beads). There was a significant difference between the two groups analysed by the Mann–Whitney U-test (n = 5, *P = 0.032). Data are presented as a boxplot with median and min–max whiskers
Pictures of Z-stacks of beads (red 0.5 μm, purple 1 μm, green 2 μm) penetrating the mucus on colonic explants from Convd 1 or Convd 2 mice. The epithelium is stained by Calcein violet (blue). Double arrows indicate impenetrable mucus. Scale bar is 100 μm.
Immunostaining of colon sections of Convd 1 or Convd 2 mice using Anti-MUC2C3 (green) and Hoechst (blue) staining DNA and visualizing bacteria in mucus (inserts). Double arrows mark the inner mucus layer that separates bacteria from the epithelium. Arrows at an angle point to bacteria in the inner mucus. Scale bars are 10 μm.
References
-
- Martins dos Santos V, Muller M, de Vos WM. Systems biology of the gut: the interplay of food, microbiota and host at the mucosal interface. Curr Opin Biotechnol. 2010;21:539–550. - PubMed
-
- Hooper LV, Macpherson AJ. Immune adaptations that maintain homeostasis with the intestinal microbiota. Nat Rev Immunol. 2010;10:159–169. - PubMed
Publication types
MeSH terms
Substances
Grants and funding
LinkOut - more resources
Full Text Sources
Other Literature Sources
Medical
Molecular Biology Databases
Miscellaneous
