

Imaging pulmonary inducible nitric oxide synthase expression with PET
- PMID: 25525182
- PMCID: PMC4501590
- DOI: 10.2967/jnumed.114.146381
Imaging pulmonary inducible nitric oxide synthase expression with PET
Abstract
Inducible nitric oxide synthase (iNOS) activity increases in acute and chronic inflammatory lung diseases. Imaging iNOS expression may be useful as an inflammation biomarker for monitoring lung disease activity. We developed a novel tracer for PET that binds to iNOS in vivo, (18)F-NOS. In this study, we tested whether (18)F-NOS could quantify iNOS expression from endotoxin-induced lung inflammation in healthy volunteers.
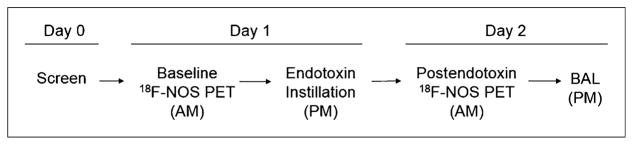
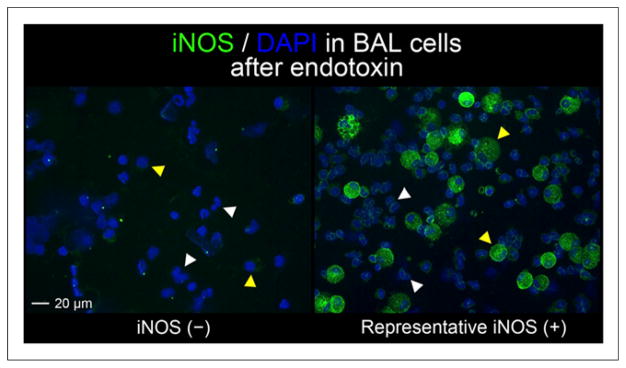
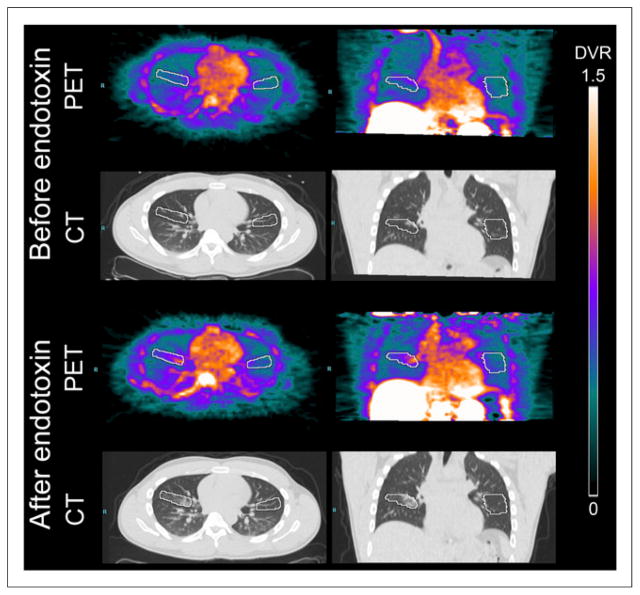
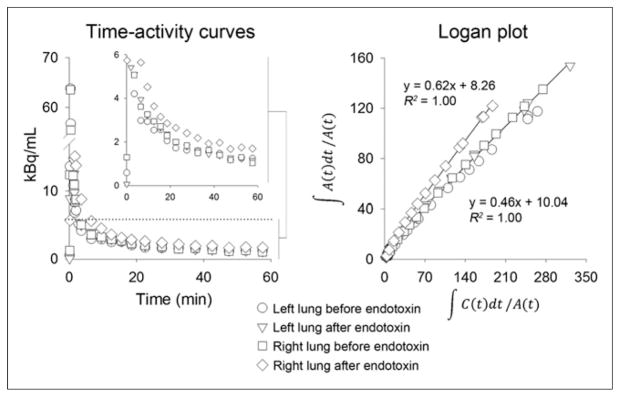
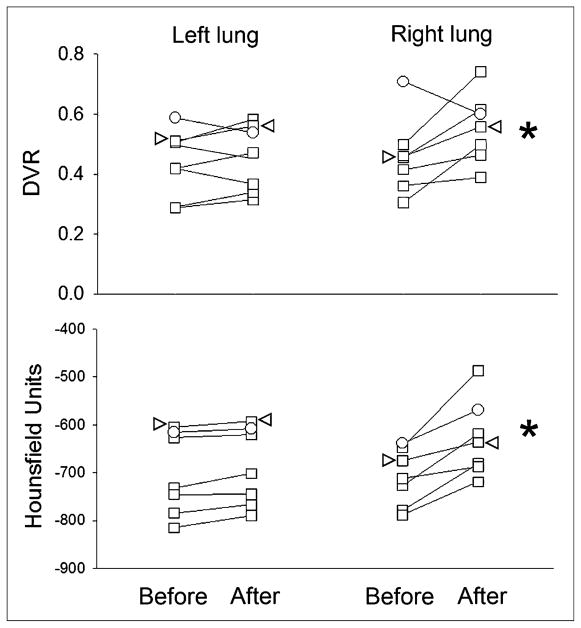
Methods: Healthy volunteers were screened to exclude cardiopulmonary disease. Qualifying volunteers underwent a baseline, 1-h dynamic (18)F-NOS PET/CT scan. Endotoxin (4 ng/kg) was then instilled bronchoscopically in the right middle lobe. (18)F-NOS imaging was performed again approximately 16 h after endotoxin instillation. Radiolabeled metabolites were determined from blood samples. Cells recovered by bronchoalveolar lavage (BAL) after imaging were stained immunohistochemically for iNOS. (18)F-NOS uptake was quantified as the distribution volume ratio (DVR) determined by Logan plot graphical analysis in volumes of interest placed over the area of endotoxin instillation and in an equivalent lung region on the left. The mean Hounsfield units (HUs) were also computed using the same volumes of interest to measure density changes.
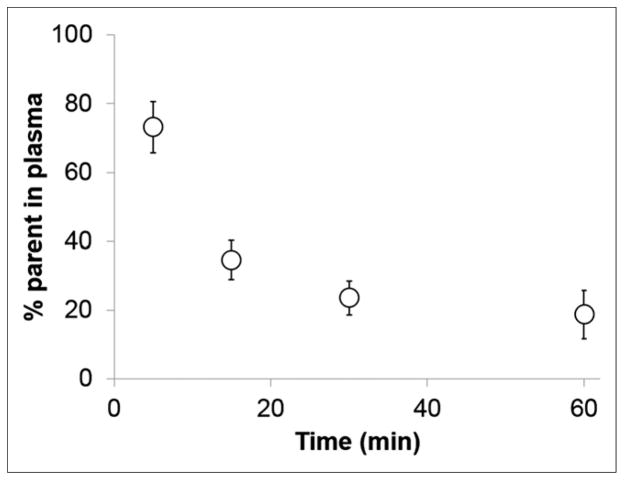
Results: Seven healthy volunteers with normal pulmonary function completed the study with evaluable data. The DVR increased by approximately 30%, from a baseline mean of 0.42 ± 0.07 to 0.54 ± 0.12, and the mean HUs by 11% after endotoxin in 6 volunteers who had positive iNOS staining in BAL cells. The DVR did not change in the left lung after endotoxin. In 1 volunteer with low-level iNOS staining in BAL cells, the mean HUs increased by 7% without an increase in DVR. Metabolism was rapid, with approximately 50% of the parent compound at 5 min and 17% at 60 min after injection.
Conclusion: (18)F-NOS can be used to image iNOS activity in acute lung inflammation in humans and may be a useful PET tracer for imaging iNOS expression in inflammatory lung disease.
Trial registration: ClinicalTrials.gov NCT01407796.
Keywords: endotoxin; inducible nitric oxide synthase; lung inflammation; positron emission tomography.
© 2015 by the Society of Nuclear Medicine and Molecular Imaging, Inc.
Figures
References
-
- Murphy SL, Xu JQ, Kochanek KD. National Vital Statistics Reports. Vol. 61. Hyattsville, MD: National Center for Health Statistics; 2013. Deaths: final data for 2010. - PubMed
-
- Adams CP, Brantner VV. Estimating the cost of new drug development: is it really 802 million dollars? Health Aff (Millwood) 2006;25:420–428. - PubMed
-
- Martinez FJ, Donohue JF, Rennard SI. The future of chronic obstructive pulmonary disease treatment: difficulties of and barriers to drug development. Lancet. 2011;378:1027–1037. - PubMed
Publication types
MeSH terms
Substances
Associated data
Grants and funding
LinkOut - more resources
Full Text Sources
Other Literature Sources
Medical