. 2014 Dec 19;346(6216):1529-33.
doi: 10.1126/science.1253799. Epub 2014 Nov 20.

Use of human embryonic stem cells to model pediatric gliomas with H3.3K27M histone mutation

Affiliations

Use of human embryonic stem cells to model pediatric gliomas with H3.3K27M histone mutation

Kosuke Funato et al. Science. .

Abstract

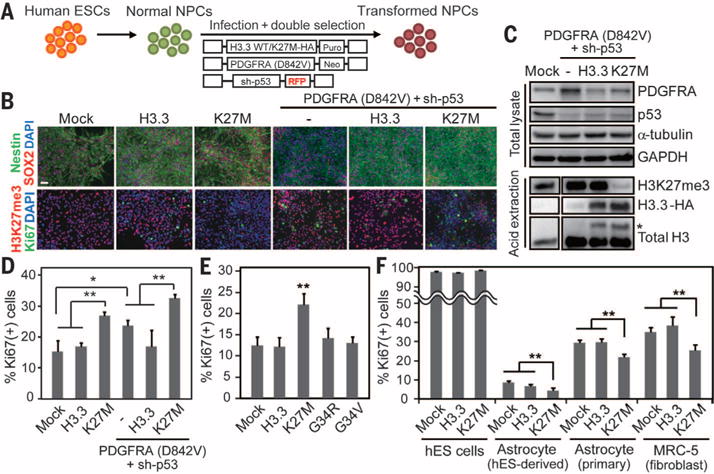
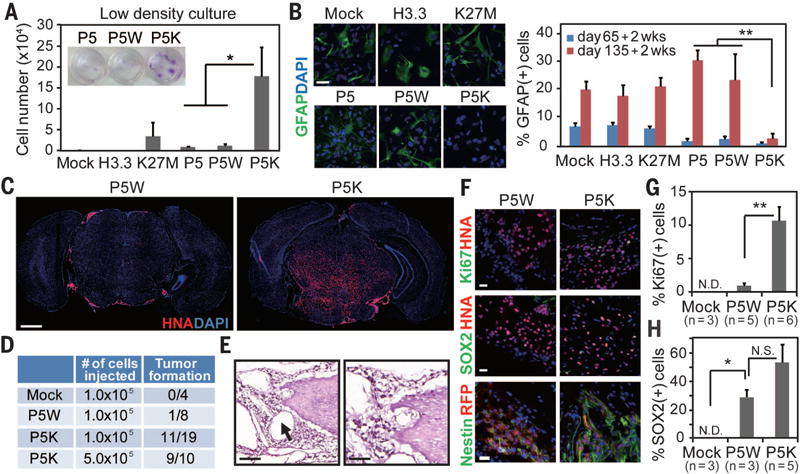
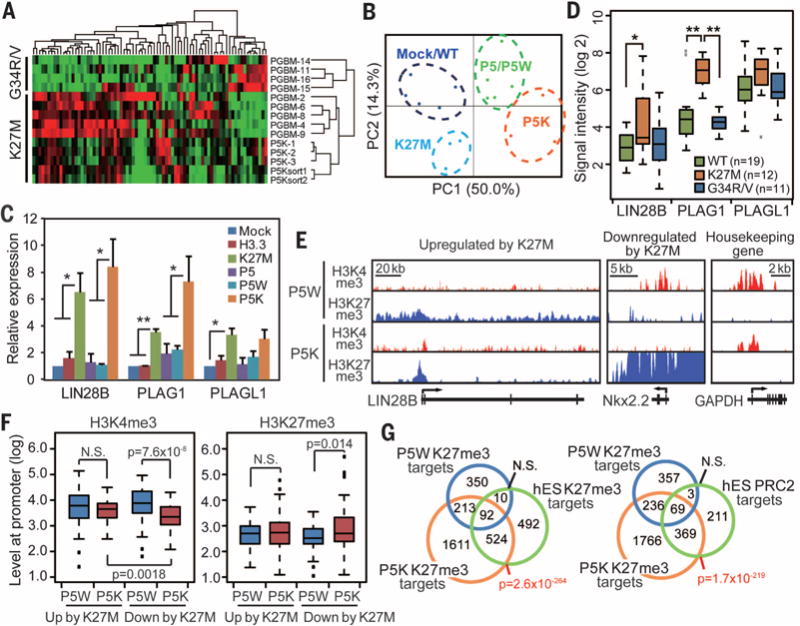
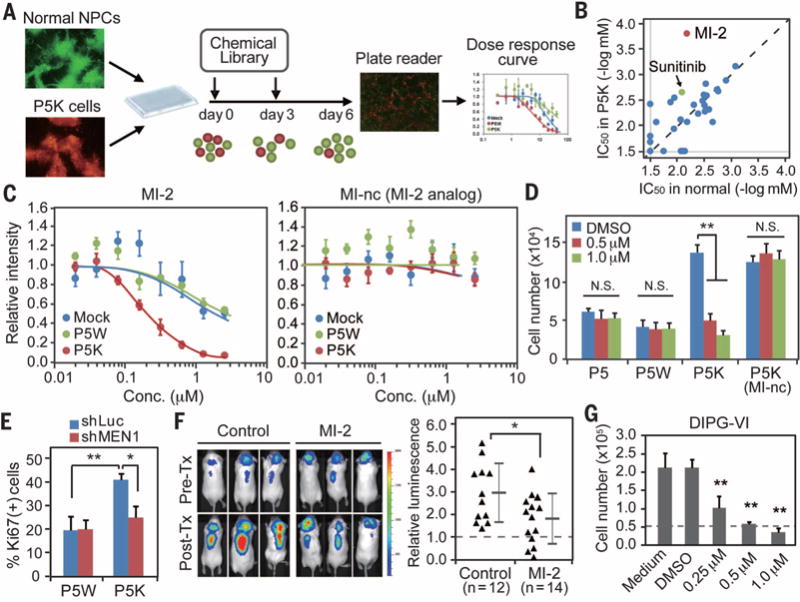
Over 70% of diffuse intrinsic pediatric gliomas, an aggressive brainstem tumor, harbor heterozygous mutations that create a K27M amino acid substitution (methionine replaces lysine 27) in the tail of histone H3.3. The role of the H3.3K27M mutation in tumorigenesis is not fully understood. Here, we use a human embryonic stem cell system to model this tumor. We show that H3.3K27M expression synergizes with p53 loss and PDGFRA activation in neural progenitor cells derived from human embryonic stem cells, resulting in neoplastic transformation. Genome-wide analyses indicate a resetting of the transformed precursors to a developmentally more primitive stem cell state, with evidence of major modifications of histone marks at several master regulator genes. Drug screening assays identified a compound targeting the protein menin as an inhibitor of tumor cell growth in vitro and in mice.


Figures

Fig. 1
Fig. 1. The impact of H3.3 K27M mutation on neural precursors
(A) hES-derived NPCs were transformed using a combination of lentiviruses encoding H3.3 WT or H3.3K27M, plus PDGFRA and sh-p53. (B) Immunohistochemistry of NPCs transduced with different vector combinations demonstrates maintenance of SOX2 and Nestin expression. DAPI, 4′,6′-diamidino-2-phenylindole. Expression of H3.3K27M (K27M) is associated with significantly reduced H3K27 trimethylation mark (H3K27me3). Ki-67 immunopositivity depicts proliferation and is most elevated in the K27M, PDGFRA, and sh-p53 conditions. Scale bar, 50 μm. (C) Western blotting of transduced NPCs. Total lysates and acid-extracted histones were separated by SDS-polyacrylamide gel electrophoresis and blotted with the indicated antibodies. Asterisk (*) beside higher bands indicates HA-tagged H3.3 transgene. (D) Quantification of Ki-67 immunostaining in transduced NPCs. (E) Proliferation index of NPCs transduced with various H3.3 mutations. (F) Impact of K27M mutation on the proliferation index of various cell lines. Error bars in panels (D) to (F) indicate means ± SD (n = 4 to 5 in each). *P < 0.05; **P < 0.01.
Fig. 2
Fig. 2. Synergistic effect of K27M and oncogenes in inducing transformation and tumorigenicity of NPCs
(A) Transduced NPCs were grown at very low density for 4 weeks, and the number of viable cells was counted by trypan blue staining. Crystal violet staining is shown in the inset. P5, P5W, and P5K indicate PDGFRA (D842V) + sh-p53, P5 + WT histone H3.3, and P5 + K27M mutant, respectively. Bars indicate means ± SD (n = 4). (B) Immunohistochemistry and quantification for the glial marker (GFAP) under the differentiation condition. Bars indicate means ± SD (n = 4 to 5). Scale bar, 20 μm. (C) Transcranial injection of P5K cells into the brainstem of mice led to tumor formation, whereas P5W cells gave rise to isolated cell clusters. Low-magnification immunofluorescence images of representative sections labeled for human nuclear antigen (HNA) and counterstained with DAPI. Scale bar, 1 mm. (D) Summary of transplantation and tumor formation. (E) Light microscopy of hematoxylin and eosin–stained representative section taken from the pons of a mouse bearing P5K tumor demonstrates encasement of the basilar artery (arrow) by tumor cells, microcystic change, and infiltration in the pons. Scale bar, 100 μm (left panel), 50 μm (right panel). (F to H) Immunophenotyping of the xenografts. Immunofluorescence images and quantification for HNA, Ki67 (F and G), SOX2 (F and H) and human-specific Nestin (F). Error bars in panels (G) and (H) indicate means ± SEM (n = 3 to 6). Scale bar, 20 μm. *P < 0.05; **P < 0.01; NS, not significant; ND, not detected.
Fig. 3
Fig. 3. Genomewide analysis of the K27M transformed NPCs
(A) Hierarchical clustering of microarray data from P5K cells, xenograft-derived P5K cells, and patient tumor samples bearing the K27M or G34R/V mutations (GSE34824) obtained from (1). (B) Principal component analysis (PCA) of microarray data obtained from NPCs transduced with the different H3.3 and oncogene combinations. (C) RT-qPCR demonstrates increased expression levels of LIN28B, PLAG1, and PLAGL1 in the P5K cells. Bars indicate means ± SEM (n = 4 to 6). (D) Boxplot shows the expression levels of the genes in patient tumor samples. (E to G) The chromatin landscape of transformed cells. P5K cells showed a global decrease in H3K27me3, but enrichment at the gene body or promoter regions of select genes as shown in representative profiles [(E) H3K4me3 in red and H3K27me3 in blue]. (F) Levels of H3K4me3 and H3K27me3 marks at the promoter region (+1 kilobase to ~500 base pairs) of the genes differentially regulated by K27M. P values were calculated by the Wilcoxon rank-sum test. (G) Venn diagrams comparing genes that are marked by H3K27me3 or bound by PRC2. *P < 0.05; **P < 0.01; NS, not significant.
Fig. 4
Fig. 4. Chemical screen of the transformed NPCs
(A) Schematic representation of the screening strategy. A mixture of GFP-labeled normal NPCs and RFP-labeled P5K cells in a 1:3 ratio were plated into 96-well plates, and each compound in the library was added in a twofold serial dilution for a total of eight doses. (B) IC50 was calculated for each compound after 6 days in vitro by using a fluorescence plate reader. (C) Representative dose-response curves in normal NPCs (mock, blue), P5W (green), and P5K (red) cells treated with MI-2 or MI-nc (MI-2 analog) show selectivity of MI-2, a menin inhibitor (n = 4). (D) Viability assay demonstrates a significant effect of MI-2 on P5K cells, with no impact on normal or P5Wcells (n = 4). (E) Silencing of menin via shRNA also decreased the proliferation of P5K cells. (F) Administration of MI-2 suppressed in vivo growth of P5K cells. Intracranial growth of luciferase-labeled P5K cells was measured by quantitative in vivo bioluminescence imaging. Values indicate fold change of luminescence before and after the treatment. (G) MI-2 treatment suppressed the proliferation of a patient DIPG-derived cell line. Cells were treated with MI-2 for 7 days, and the number of viable cells was counted by trypan blue staining (n = 4). Error bars in panels (C) to (G) indicate means ± SD. *P < 0.05; **P < 0.01; NS, not significant.

Comment in

References

    1. Schwartzentruber J, et al. Nature. 2012;482:226–231. - PubMed
    1. Wu G, et al. Nat Genet. 2012;44:251–253. - PMC - PubMed
    1. Zhang J, et al. Nat Genet. 2013;45:602–612. - PMC - PubMed
    1. Sturm D, et al. Cancer Cell. 2012;22:425–437. - PubMed
    1. Khuong-Quang DA, et al. Acta Neuropathol. 2012;124:439–447. - PMC - PubMed

Publication types

MeSH terms

Associated data