. 2014 Dec 19;346(6216):1533-6.
doi: 10.1126/science.1255301. Epub 2014 Dec 18.

Promoter architecture dictates cell-to-cell variability in gene expression

Affiliations

Promoter architecture dictates cell-to-cell variability in gene expression

Daniel L Jones et al. Science. .

Abstract

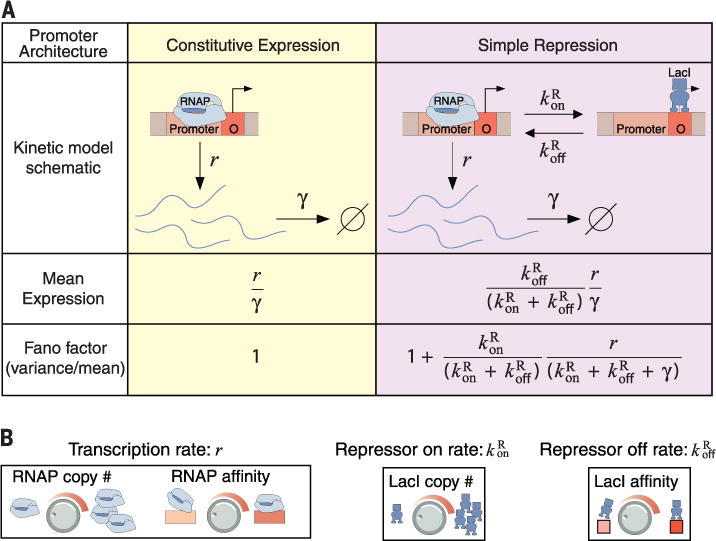
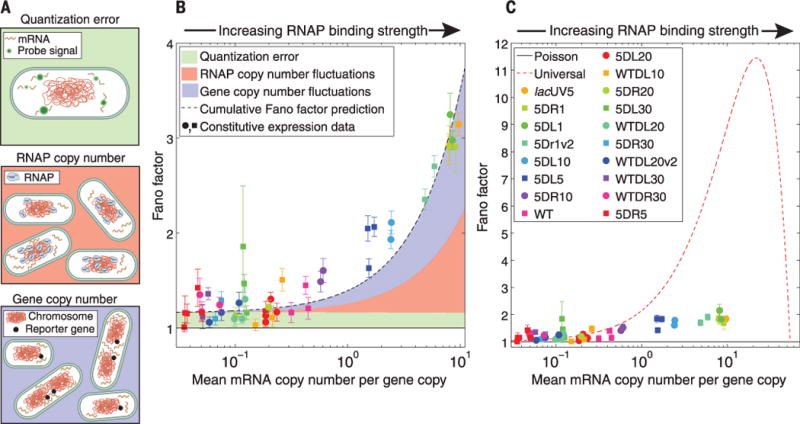
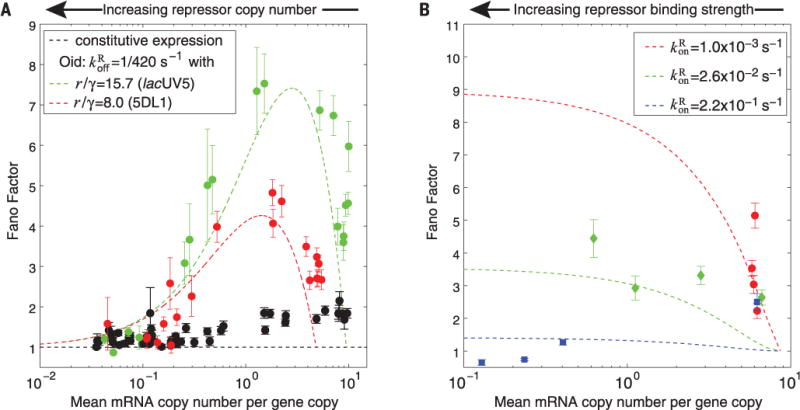
Variability in gene expression among genetically identical cells has emerged as a central preoccupation in the study of gene regulation; however, a divide exists between the predictions of molecular models of prokaryotic transcriptional regulation and genome-wide experimental studies suggesting that this variability is indifferent to the underlying regulatory architecture. We constructed a set of promoters in Escherichia coli in which promoter strength, transcription factor binding strength, and transcription factor copy numbers are systematically varied, and used messenger RNA (mRNA) fluorescence in situ hybridization to observe how these changes affected variability in gene expression. Our parameter-free models predicted the observed variability; hence, the molecular details of transcription dictate variability in mRNA expression, and transcriptional noise is specifically tunable and thus represents an evolutionarily accessible phenotypic parameter.


Figures

Fig. 1
Fig. 1. Schematics of the kinetics of transcription for two simple regulatory architectures
(A) Theoretical treatment of two common promoter architectures and the predicted expression (both mean and variability) as a function of the relevant rate parameters. (B) Examples of the experimental knobs available for tuning the various model rate parameters: Basal transcription rate r is tuned by RNAP copy number and RNAP binding site affinity (left); repressor binding rate konR is tuned by repressor copy number (center); and repressor unbinding rate koffR is tuned by its binding site affinity (right).
Fig. 2
Fig. 2. Variability in gene expression for constitutive expression
(A) Examples of additional noise sources (not accounted for in models of chemical kinetics) present in expression measurements. (B) Fano factor (gene copy number variation not subtracted) versus mean expression, plotted for each of 18 constitutive promoters along with estimates of the contributions shown schematically in (A). These factors can account for essentially the entirety of the deviation from Fano = 1. (C) Measured Fano factor for various promoters under constitutive expression, with gene copy number variation subtracted. For reference, the predictions of pure Poissonian production (black solid line) and the “universal noise” curve observed in (5) (red dashed) theories are shown. In (B) and (C), each strain is represented by a unique symbol, and each instance represents repeated measurements with error bars from bootstrap sampling expression measurements of individual cells.
Fig. 3
Fig. 3. Variability in gene expression for systematic tuning of repression
(A) Fano factor versus mean mRNA copy number for two promoters (choices of r/γ) while tuning konR by inducing LacI to varying levels. For reference, the black data are the constitutive data from Fig. 2. (B) Fano factor versus mean mRNA copy number for lacUV5 while tuning koffR by changing repressor binding site identity at fixed repressor copy number; each color represents a different induction condition from red (lowest LacI induction) to blue (highest LacI induction). For both (A) and (B), the parameter-free predictions from kinetic theory are shown as dashed lines in the corresponding color, holding promoter (r/γ) and (A) repressor binding strength koffR or (B) repressor binding rate koffR constant. In both cases, the Fano factor at a given mean depends on the choice of molecular parameters and agrees with the expectations from theory. The effect of gene copy number variation was subtracted from all data points; error bars result from bootstrap sampling expression measurements of individual cells.

References

    1. Paulsson J, Ehrenberg M. Phys Rev Lett. 2000;84:5447–5450. - PubMed
    1. Sanchez A, Garcia HG, Jones D, Phillips R, Kondev J. PLOS Comput Biol. 2011;7:e1001100. - PMC - PubMed
    1. Taniguchi Y, et al. Science. 2010;329:533–538. - PMC - PubMed
    1. Blake WJ, et al. Mol Cell. 2006;24:853–865. - PubMed
    1. So LH, et al. Nat Genet. 2011;43:554–560. - PMC - PubMed

Publication types

LinkOut - more resources