. 2015 Feb 6;290(6):3836-49.
doi: 10.1074/jbc.M114.613166. Epub 2014 Dec 17.

Bacteriophage SPP1 tail tube protein self-assembles into β-structure-rich tubes

Affiliations

Bacteriophage SPP1 tail tube protein self-assembles into β-structure-rich tubes

Chantal Langlois et al. J Biol Chem. .

Abstract

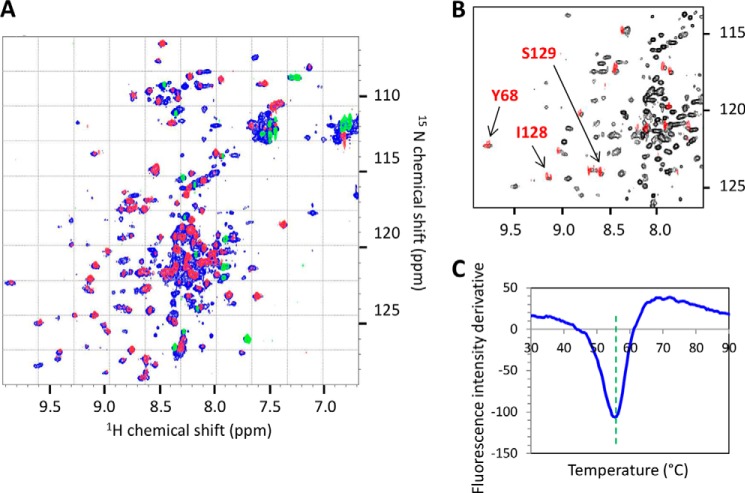
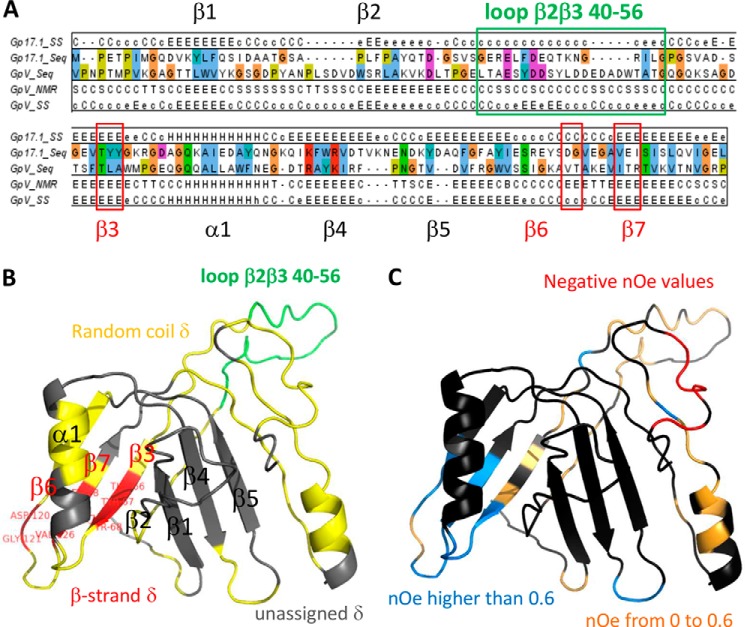
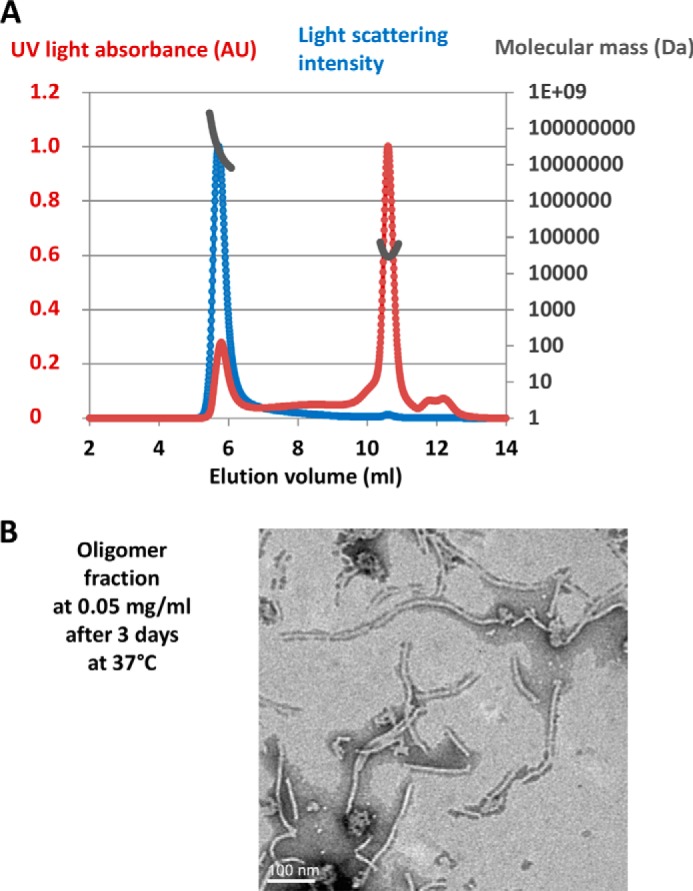
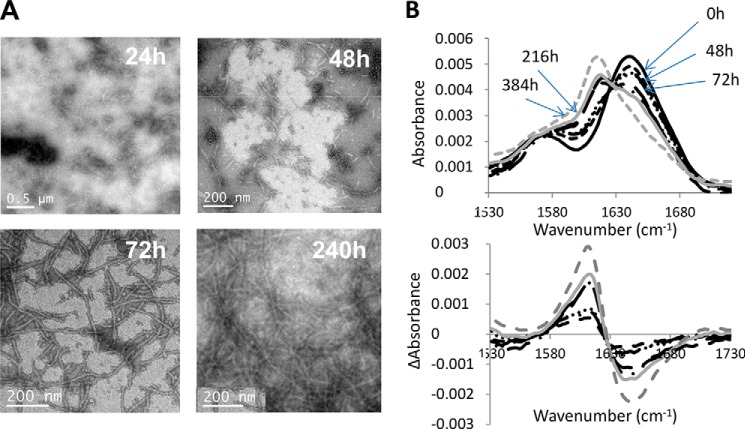
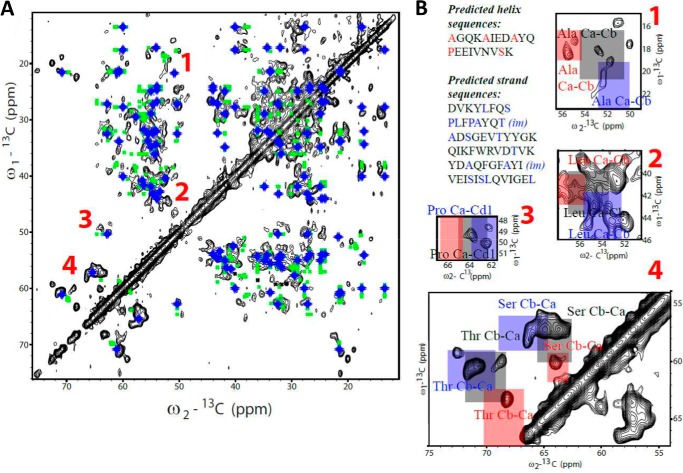
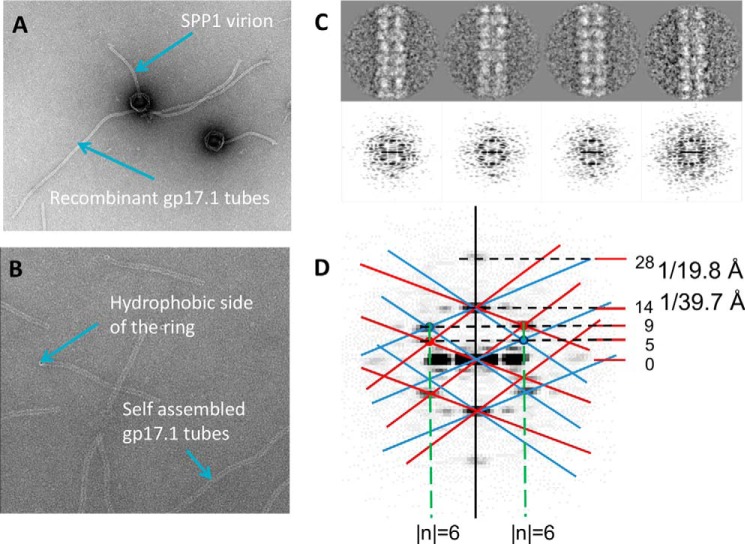
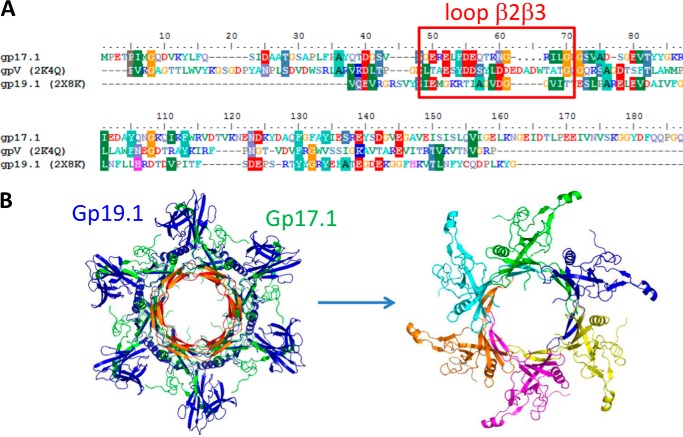
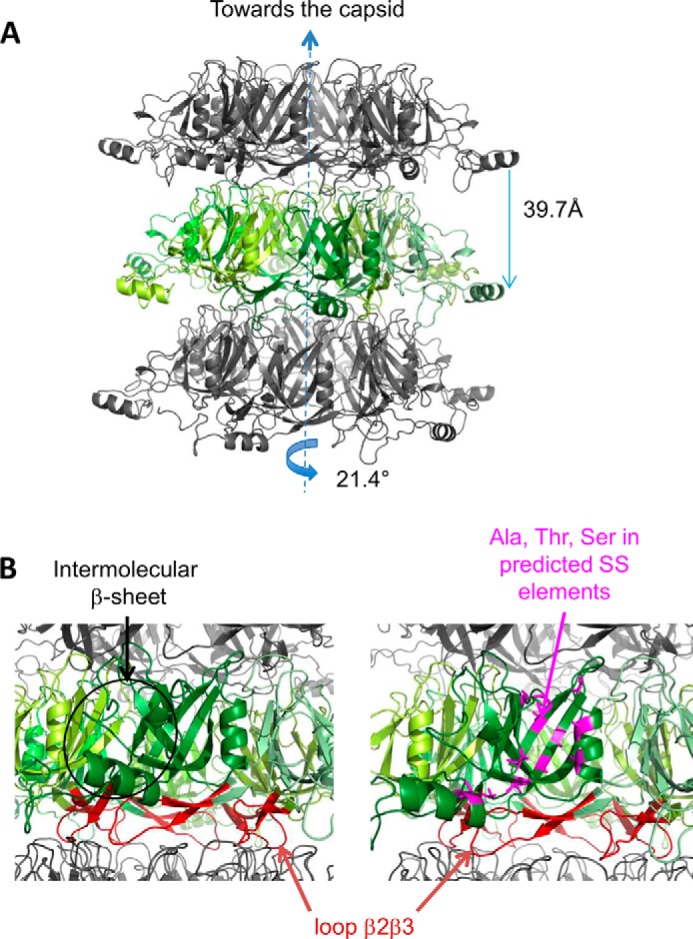
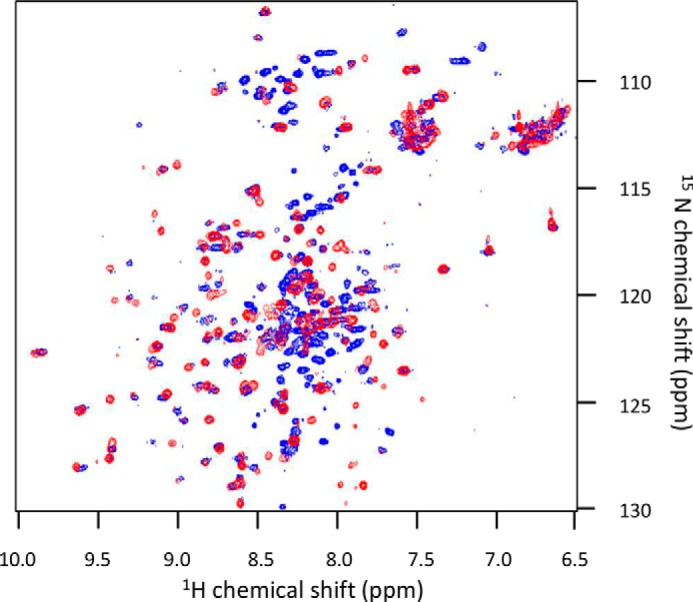
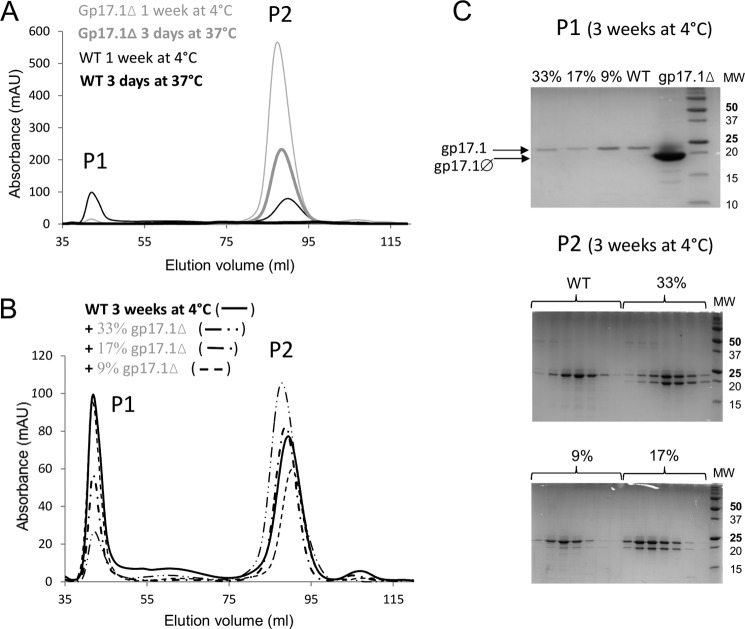
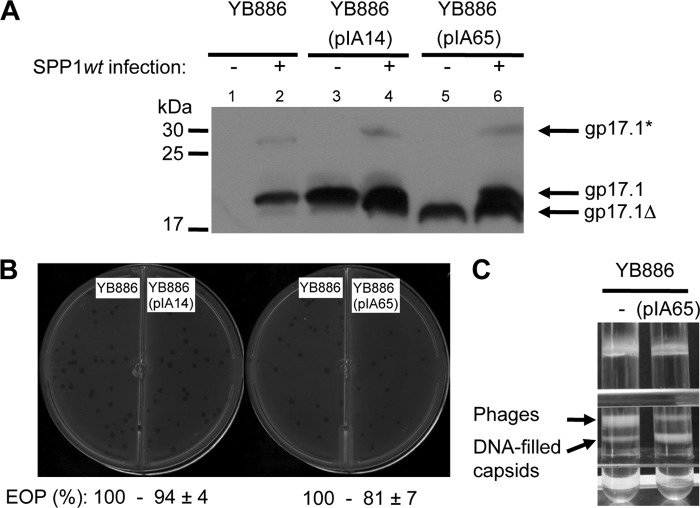
The majority of known bacteriophages have long tails that serve for bacterial target recognition and viral DNA delivery into the host. These structures form a tube from the viral capsid to the bacterial cell. The tube is formed primarily by a helical array of tail tube protein (TTP) subunits. In phages with a contractile tail, the TTP tube is surrounded by a sheath structure. Here, we report the first evidence that a phage TTP, gp17.1 of siphophage SPP1, self-assembles into long tubes in the absence of other viral proteins. gp17.1 does not exhibit a stable globular structure when monomeric in solution, even if it was confidently predicted to adopt the β-sandwich fold of phage λ TTP. However, Fourier transform infrared and nuclear magnetic resonance spectroscopy analyses showed that its β-sheet content increases significantly during tube assembly, suggesting that gp17.1 acquires a stable β-sandwich fold only after self-assembly. EM analyses revealed that the tube is formed by hexameric rings stacked helicoidally with the same organization and helical parameters found for the tail of SPP1 virions. These parameters were used to build a pseudo-atomic model of the TTP tube. The large loop spanning residues 40-56 is located on the inner surface of the tube, at the interface between adjacent monomers and hexamers. In line with our structural predictions, deletion of this loop hinders gp17.1 tube assembly in vitro and interferes with SPP1 tail assembly during phage particle morphogenesis in bacteria.

Keywords: Bacteriophage; Electron Microscopy; Fourier Transform IR (FTIR); Solid State NMR; Tail Tube; Tertiary Structure; Virion; Virus Assembly.


Figures

FIGURE 1.
FIGURE 1.
Structural analysis of gp17.1SPP1 in 50 mm sodium phosphate, pH 6.0, and 150 mm NaCl. A and B, solution-state NMR study of gp17.1 SPP1 at 700 MHz and 25 °C. A, superimposition of the 1H-15N HSQC spectrum (blue) and the saturated 1H → 15N NOE spectrum (red and green). Only 15 NH belong to completely unstructured residues (green peaks in the saturated experiment). B, zoom views of 1H-15N HSQC spectra recorded 1 h after dissolution of the sample in 10% (black) or 100% (red) D2O. Only 12 NH are still protonated in 100% D2O. C, fluorescence analysis of the thermal denaturation of gp17.1SPP1 in the presence of SYPRO Orange. Evolution of the SYPRO Orange fluorescence signal is followed as a function of the temperature. The opposite of the first derivative of the fluorescence signal is plotted to clearly read the denaturation temperature as the curve minimum that is highlighted by the dashed green line.
FIGURE 2.
FIGURE 2.
Molecular modeling of the gp17.1 monomer. A, sequence alignment between residues 1 and 138 of SPP1 gp17.1 (177 amino acids) and residues 6 and 152 of the N-terminal domain of phage λ gpV (156 amino acids), as proposed by HHpred. gp17.1_SS and gpV_SS correspond to secondary structure predictions using PsiPred and GpV_NMR to secondary structure elements determined using DSSP from the NMR structure of gpV (PDB code 2K4Q). B and C, gp17.1 model calculated by I-TASSER, based on the structural analogy between gp17.1 and gpV. B, ribbon is colored based on the gp17.1 NMR chemical shift analysis as follows: unassigned residues in gray; assigned residues in secondary structure elements in red (as deduced from chemical shift analysis using Predator); and assigned residues not involved in secondary structures in yellow and green (for loop 40–56). The eight residues in red (Thr-66, Tyr-67, Tyr-68, Asp-120, Gly-121, Val-126, Glu-127, and Ile-128) are labeled. C, ribbon is colored based on the gp17.1 1H → 15N NOE analysis as follows: unassigned residues are rendered in dark gray; assigned residues with reduced local mobility in cyan (NOE >0.6); assigned residues in flexible regions in orange (0 < NOE < 0.6); and assigned residues in unstructured regions in red (NOE <0).
FIGURE 3.
FIGURE 3.
Association of gp17.1 with time. A, SEC-MALS experiment performed on a 2 mg/ml gp17.1 sample injected on a Shodex KW-804 column pre-equilibrated with 20 mm sodium phosphate buffer, pH 7.5, and 50 mm NaCl. The UV light absorbance (UV), differential refractive index, and light scattering intensity were measured as a function of the elution volume. Molecular masses calculated by the MALS-UV-refractive index method (gray) are plotted against elution volume with UV light absorbance (red) and light scattering intensity (blue) traces overlaid. The second peak corresponds to a mass of 28.8 ± 2.4 kDa, slightly higher than the mass of a monomer (20.2 kDa), whereas the first peak corresponds to largely heterogeneous oligomers with a molecular mass superior to 1000 kDa. B, micrograph of material from the oligomer peak at 0.05 mg/ml, 3 days after elution from the chromatography column. The sample was negatively stained with 0.5% phosphotungstic acid.
FIGURE 4.
FIGURE 4.
Time-dependent gp17.1 tube formation followed using TEM (A) and FTIR (B) on a protein sample at 3 mg/ml in 20 mm phosphate buffer, pH 7.5, and 50 mm NaCl. A, TEM images were obtained after incubation of gp17.1 monomers at 37 °C during 24, 48, 72, and 240 h. The samples were negatively stained with 0.5% phosphotungstic acid. In parallel, FTIR measurements were performed for the same samples (B). FTIR buffer-subtracted spectra of the 1530–1730 cm−1 region are displayed in the upper part of B as a function of the gp17.1 incubation time at 37 °C as follows: black bold lines at time 0; black dotted lines and after 48 h (· · ·) 72 h (-●-), 96 h (●●●●), 168 h (— —), 192 h (-●●-); gray lines after 216 h (solid) and 348 h (dotted). Difference absorbance spectra calculated by subtracting the buffer-subtracted spectrum corresponding to time 0 to the buffer-subtracted spectra recorded at different times are shown in the lower part of B.
FIGURE 5.
FIGURE 5.
13C-13C ssNMR spectrum of a uniformly 13C,15N-labeled gp17.1 tube sample recorded at 800 MHz and 253 K (peaks are displayed in black). A, green symbols reflect correlations predicted on the basis of solution NMR assignments, and blue symbols correspond to chemical shifts calculated for a 100% β-structure. B, zooms of the spectrum that display 13C-13C correlations corresponding to alanines (1), leucines (2), prolines (3), and threonines and serines (4). Spectral regions corresponding to random coil 13C chemical shifts are colored in gray, and those corresponding to β-strand and α-helix chemical shifts are colored in blue and red, respectively (42). The amino acid sequences of the secondary structure elements identified by PSIPRED in gp17.1 are displayed next to the spectra. In these sequences, alanines, leucines, prolines, threonines, and serines are colored in blue (β-strands) and red (α-helices). Predicted β-strands belonging to intermolecular β-sheets in the pseudo-atomic model of gp17.1 tubes (Figs. 7 and 8) are marked as “im” (for intermolecular).
FIGURE 6.
FIGURE 6.
TEM analysis of self-assembled gp17.1 tubes. A, gp17.1 tubes mixed with SPP1 virions challenged with the receptor YueB780 to visualize the empty tail tube (38). B, images of self-assembled gp17.1 tubes. Tilting of the tube ends toward the viewer, probably due to gp17.1 hydrophobic regions sticking to the carbon film, provides very clear images of the tail ring. A and B, samples were negatively stained with 2% uranyl acetate. C, four classes of 10 images (top) from side views of three tube rings and their corresponding diffraction patterns. D, order of the Bessel functions (reflections) and parameters of the helical packing (see “Experimental Procedures”). The lattice corresponding to the helix is superimposed on the diffraction pattern. Layer lines are indicated.
FIGURE 7.
FIGURE 7.
Modeling of the gp17.1 hexamer. A, sequence alignment of SPP1 gp17.1 with residues 12–152 of phage λ gpV N-terminal domain and residues 26–138 of SPP1 gp19.1 N-terminal domain. Sequences corresponding to loop β2β3 of gp17.1 and homologous loops in gpV and gp19.1 are boxed in red. B, top views of the gp17.1 hexamer model, either superimposed in green to the gp19.1 x-ray structure rendered in blue (left, loop β2β3 of gp17.1 is shown in red and the corresponding large loop of gp19.1 is in orange) or displayed using a specific color for each subunit (right).
FIGURE 8.
FIGURE 8.
Modeling of the atomic structure of self-assembled gp17.1 tubes. A, view of three stacked gp17.1 hexamers. The central hexamer is colored in green, with each monomer being characterized by a specific tone of green. B, zooms of A with loops β2β3 colored in red. On the right view, alanine, threonine, and serine residues belonging to predicted secondary structure elements (Fig. 5A) are represented by magenta sticks.
FIGURE 9.
FIGURE 9.
Superimposition of the 1H-15N HSQC spectra of gp17.1SPP1 and gp17.1Δ acquired in low salt conditions (100–150 mm NaCl) at 25 °C. The blue spectrum was acquired on gp17.1SPP1 and is the same as in Fig. 1A. The red spectrum was obtained on gp17.1Δ in 20 mm sodium phosphate, pH 7.0, 100 mm NaCl.
FIGURE 10.
FIGURE 10.
SEC behavior of gp17.1Δ and its interference with gp17.1 oligomerization. A, SEC of gp17.1 (black) and gp17.1Δ (gray) after 3 days at 37 °C (thick lines) or 1 week at 4 °C (thin lines). All protein samples were injected at ∼2 mg/ml on a Superdex 200 16/60 HR column equilibrated in 20 mm sodium phosphate, pH 7.5, 50 mm NaCl. Calibration of the column showed that P1 and P2 would correspond to molecular masses higher than 500 kDa and equal to 21 kDa in the case of globular proteins, respectively. B, SEC of gp17.1 (), gp17.1 with 33% of gp17.1Δ (—··), 17% of gp17.1Δ (—·), and 9% of gp17.1Δ (--) after 3 weeks at 4 °C. Concentrations of all the injected samples were between 1.5 and 2 mg/ml. Percentages corresponded to mass ratios. C, SDS-PAGE of fractions eluted in B. One fraction of peak P1 (top gel) and several fractions covering peak P2 (middle and bottom gels) of the different samples run in B were analyzed. A gp17.1Δ sample was added as a reference in the top gel. Only gp17.1 was detected in peak P1, and both gp17.1 and gp17.1Δ were eluted in peak P2.
FIGURE 11.
FIGURE 11.
Impact of gp17.1Δ on SPP1 tail assembly. A, TTP production before (lanes 1, 3, and 5) or after (lanes 2, 4, and 6) infection with SPP1 wild type of YB886 strains bearing the plasmids indicated within parentheses. The gp17.1, gp17.1*, and gp17.1Δ proteins were detected in cell lysates using a polyclonal antiserum raised against the N-terminal region of gp17.1 (12). The different TTPs are identified by black arrows on the right and the position of migration of molecular mass markers is shown on the left. B, plaque assays. Morphology of SPP1 wild-type phage plaques in strains YB886, YB886 (pIA14), and YB886 (pIA65) at 30 °C. The efficiency of plating (EOP) is indicated below each titration tested, and standard deviations were calculated from five independent experiments. C, isopycnic centrifugation of phages produced during SPP1 wild-type infection of YB886 bearing plasmid pIA65 or without plasmid (control). The picture shows centrifuge tubes after centrifugation of the virions through a discontinuous density gradient with preformed layers of 1.7, 1.5, and 1.45 g cm−3 CsCl in TBT buffer. The upper band corresponds to entire phage particles and the lower band to tailless capsids filled with DNA (11).

References

    1. Ackermann H. W. (2007) 5500 phages examined in the electron microscope. Arch. Virol. 152, 227–243 - PubMed
    1. Katsura I. (1990) Mechanism of length determination in bacteriophage λ tails. Adv. Biophys. 26, 1–18 - PubMed
    1. Veesler D., Cambillau C. (2011) A common evolutionary origin for tailed-bacteriophage functional modules and bacterial machineries. Microbiol. Mol. Biol. Rev. 75, 423–433 - PMC - PubMed
    1. King J. (1971) Bacteriophage T4 tail assembly: four steps in core formation. J. Mol. Biol. 58, 693–709 - PubMed
    1. Davidson A. R., Cardarelli L., Pell L. G., Radford D. R., Maxwell K. L. (2012) Long noncontractile tail machines of bacteriophages. Adv. Exp. Med. Biol. 726, 115–142 - PubMed

Publication types

LinkOut - more resources