Review
. 2014 Dec 1;8(Suppl 4):1-11.
doi: 10.4137/CMC.S19005. eCollection 2014.

Native T1 mapping of the heart - a pictorial review

Affiliations
Review

Native T1 mapping of the heart - a pictorial review

Philippe Germain et al. Clin Med Insights Cardiol. .

Abstract

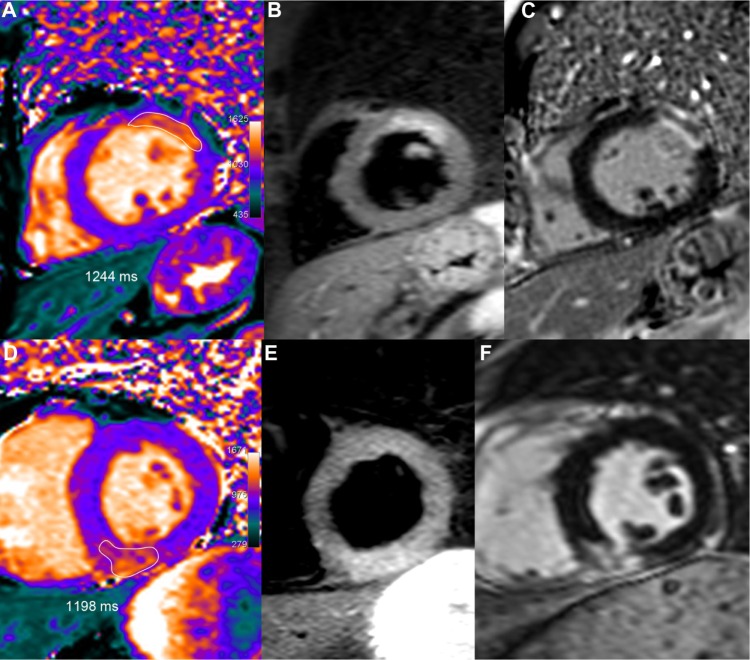
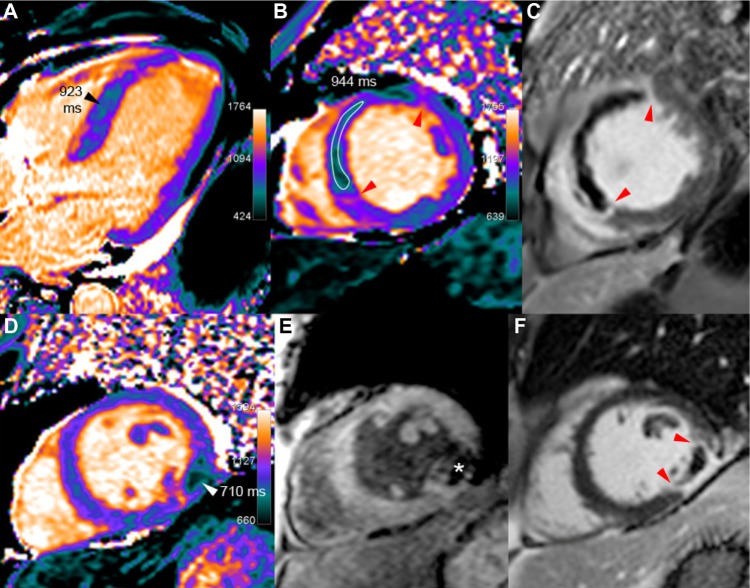
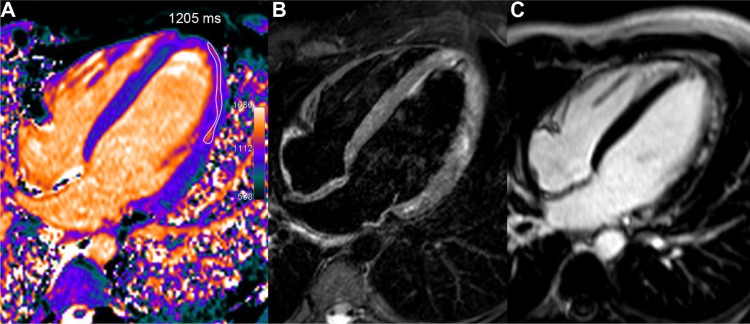
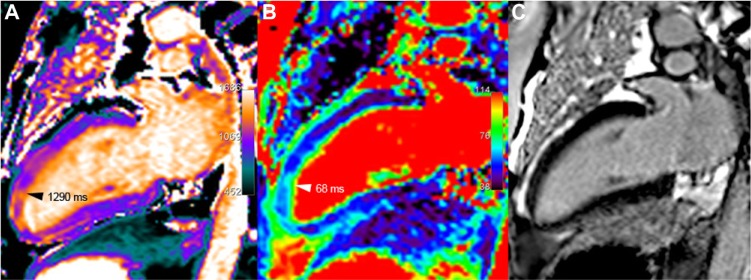
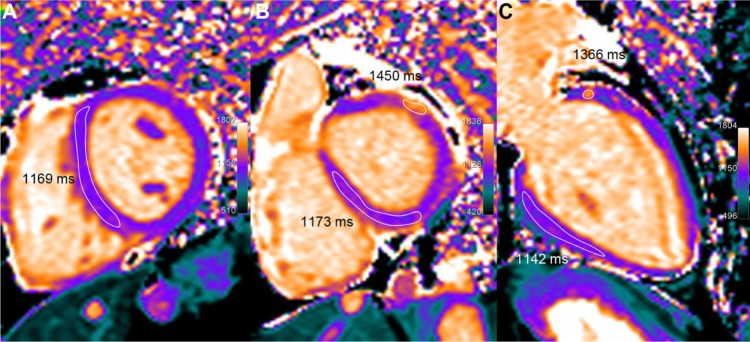
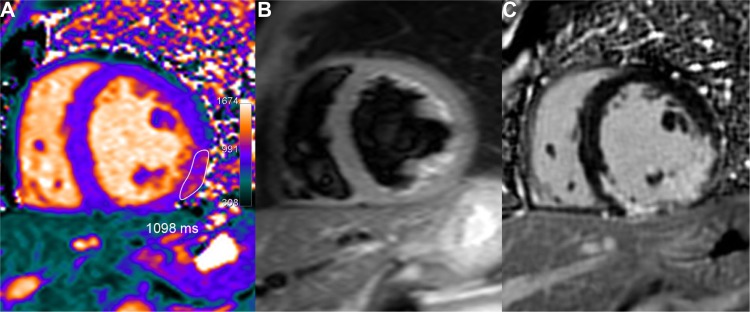
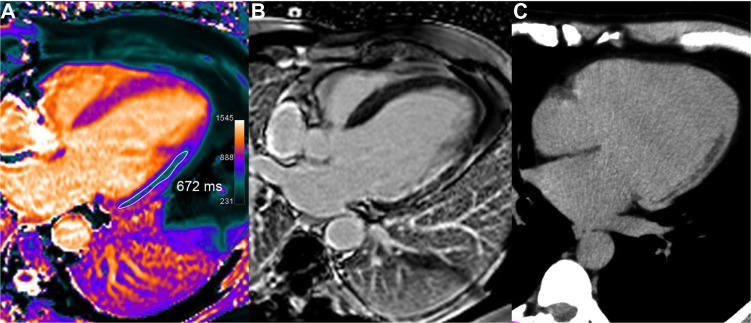
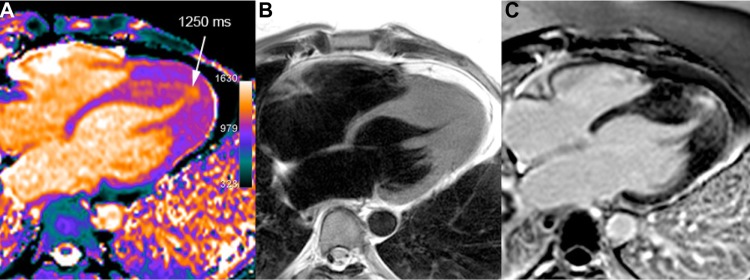
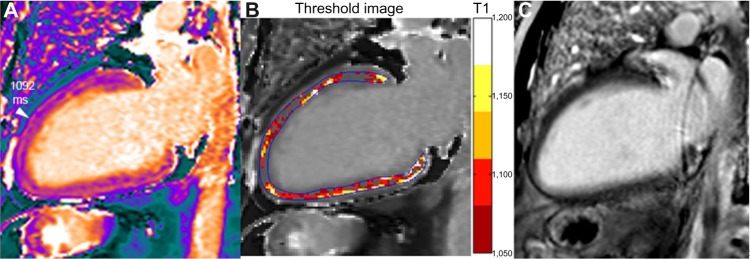
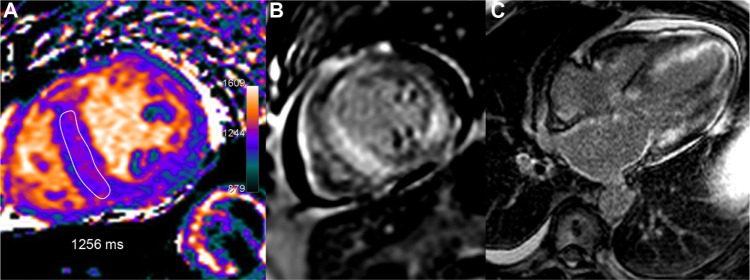
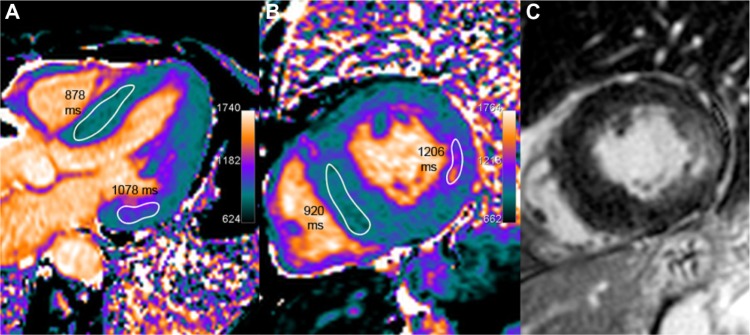
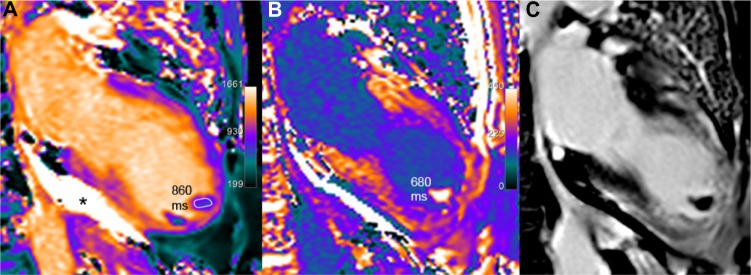
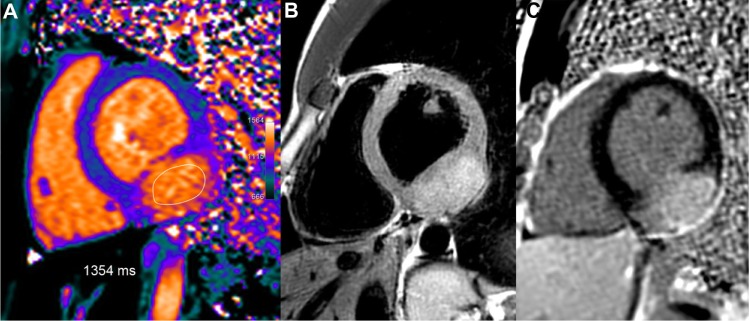
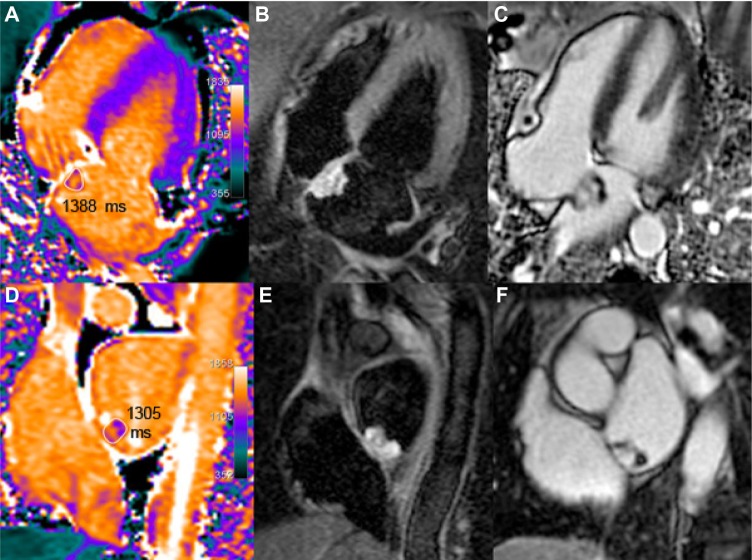
T1 mapping is now a clinically feasible method, providing pixel-wise quantification of the cardiac structure's T1 values. Beyond focal lesions, well depicted by late gadolinium enhancement sequences, it has become possible to discriminate diffuse myocardial alterations, previously not assessable by noninvasive means. The strength of this method includes the high reproducibility and immediate clinical applicability, even without the use of contrast media injection (native or pre-contrast T1). The two most important determinants of native T1 augmentation are (1) edema related to tissue water increase (recent infarction or inflammation) and (2) interstitial space increase related to fibrosis (infarction scar, cardiomyopathy) or to amyloidosis. Conversely, lipid (Anderson-Fabry) or iron overload diseases are responsible for T1 reduction. In this pictorial review, the main features provided by native T1 mapping are discussed and illustrated, with a special focus on the awaited clinical purpose of this unique, promising new method.

Keywords: T1 mapping; cardiac magnetic resonance; cardiomyopathy; edema; fibrosis; myocardial infarction.


Figures

Figure 1
Figure 1
Two examples of acute MI. Notes: Upper row: 51-year-old male who underwent primary percutaneous coronary intervention (PCI) for an occluded obtuse marginal. After one week, T1 mapping (A) showed increased T1 values (1244 ms, ie, +21% or +5.5 SD vs remote myocardium) in the area of the anterior wall corresponding to the edema depicted by T2-STIR (B), with a larger extent than on LGE imaging (C). Lower row: 52-year-old male presenting an acute inferior infarction related to a right coronary occlusion treated by PCI. Peak troponin I reached 13. At the third day, T1 mapping (D) demonstrated an inferior transmural T1 increase (1198 ms, ie, +15%, or +4.1 SD vs remote myocardium) in the same area than T2-STIR (E) and slightly greater than on LGE imaging (F).
Figure 2
Figure 2
Acute MI with no-reflow and with hemorrhage. Notes: (a) Upper row: 60-year-old male at the fifth day of an extensive acute septal STEMI, treated by left anterior descending artery (LAD) stenting for proximal occlusion. T1 maps (A and B) show low T1 values (in the range of 930 ms vs 1060 ms in the remote lateral myocardium) in the large no-reflow area extending to almost the entire septum, leaving a thin rim of hyper-enhancement on LGE images (C), confined to the periphery of the infarcted area (red arrow-heads). (b) Lower row: 54-year-old male, six days after acute lateral infarction because of the occlusion of the obtuse marginal branch, revascularized with a stent. Two concordant arguments are in favor of hemorrhage within the infarct core surrounded by post-contrast hyper-enhancement (red arrow-head in F): markedly reduced T1 (710 ms) and strongly reduced signal on T2*-weighted GRE imaging (TE 24 ms), with T2* calculated at 12 ms (white star in E).
Figure 3
Figure 3
Acute myocarditis in a young 22-year-old male with troponin I rise up to 34 and recent history of gastro-enteritis. T1 map (A), obtained one week after the acute chest pain, shows a rim of high T1 values in the mid and distal lateral walls (1205 ms, ie, +15% or +4.1 SD vs 1044 ms in the septum). T2-STIR imaging (B) found a similar high signal area in several parts of the lateral wall and at the apex. Corresponding LGE image (C) depicts more clearly the cluster of sub-epicardial hyper-enhanced foci in the same location.
Figure 4
Figure 4
Tako-tsubo syndrome, in a 74-year-old female who presented an anaphylactic shock during orthopedic surgery, requiring the administration of adrenalin, followed by heart failure (EF 40% with anterior-apical dyskinesia). At the time of imaging, 11 days after the acute event, systolic dysfunction has almost disappeared with mild persistent segmental hypokinesia, but anterior distal myocardial edema remains still visible on both T1 (A) and T2 (B) mapping, whereas no abnormal signal enhancement is seen in the corresponding area, using LGE (C).
Figure 5
Figure 5
A 67-year-old patient with heart transplantation 5 years ago, presenting clinical and histologic signs of acute rejection. LV volumetric (70 mL/m2) and ejection fraction (60%) are preserved and LGE does not show significant abnormality but T1 mapping demonstrates definitely elevated T1 values (in the range of 1160 ms, ie, +12% or +3.2 SD as compared with normal T1 values in healthy subjects). Moreover, a small nodular of even higher T1 increase (approx. 1400 ms) is seen in the anterior-basal wall. Concomitant T2 elevation (62 ms) suggests an inflammatory process rather than a diffuse interstitial fibrosis.
Figure 6
Figure 6
Chronic inferior-lateral MI partially depicted by native T1 mapping. Fibrous infarct scar appears as a limited residual area of mildly elevated T1 values in the T1 map (A) (1098 ms ie, + 9% or + 2.3 SD vs remote septal wall), covering only partially the much larger area of LGE (C). Lateral wall dyskinesia and low ejection fraction (41%) may explain some signal enhancement around the inferior papillary muscle because of blood stagnation in the T2-STIR image (B).
Figure 7
Figure 7
Chronic lateral infarction with lipomatous metaplasia. In this 50-year-old patient with previous lateral infarction 5 years ago, T1 mapping (A) shows an extensive subendocardial area of low T1 values (in the range of 672 ms, ie, −34% or −8.7 SD vs remote septal wall) resulting from fatty replacement, not identified on LGE image (B) but corroborated by fat suppression techniques and by CT scan (C).
Figure 8
Figure 8
Apical HCM in a 40-year-old man. T1 mapping (A) shows an area of elevated T1 values in the apical and septal distal thickened walls (white arrow) reaching up to 27 mm (diastolic TSE-Blade image – B). A large area of mid-wall patchy heterogeneous fibrosis is seen in the same area on LGE image (C).
Figure 9
Figure 9
A 62-year-old male with DCM and left bundle branch block (LVEDVI 135 mL/m, EF 25% and normal coronary angiography). Small scattered slightly increased T1 areas are seen in the T1 map (A), but no corresponding abnormal area is seen in the LGE image (C). Signal measurement demonstrates overall T1 increase (1122 ms ie, +9% or +2.3 SD vs healthy myocardium). In contrast to the case of diffuse myocardial edema shown in Figure 5, T1 increase is not associated here with elevated T2 (in the range 51 ms), thus T1 augmentation is consistent with diffuse interstitial fibrosis. Mapping of pixels exceeding a threshold value (T1 >1050 ms in the example shown in B) demonstrates the extent and location of abnormal myocardial area (non-ischemic pattern distribution in this case with DCM).
Figure 10
Figure 10
A 66-year-old male with AL amyloidosis, heart failure, and marked restrictive echocardiographic pattern. T1 map (A) shows a heterogeneous T1 increase with septal values in the range of 1256 ms, ie, +22% or +5.7 SD vs healthy myocardium. Typical diffuse subendocardial hyper enhancement is seen on LGE images (B, C).
Figure 11
Figure 11
A 64-year-old female with Anderson–Fabry disease. The septum thickness is increased, up to 17 mm (left ventricular mass index 95 g/m2). Myocardial T1 is uniformly low (in the range of 900 ms, as seen on five-chamber and short axis slices in A and B), which is consistent with sphingolipids deposition in this patient. A typical feature of patchy fibrotic involvement of the lateral basal wall is seen with focal T1 pseudo-normalization or even slight increase (approximately 1150 ms) and co-localized signal increase on LGE imaging (C).
Figure 12
Figure 12
Two apical thrombi (maximal long axis 16 mm) are seen at the apex of the left ventricle in this 69-year-old patient with large apical dyskinesia following LAD occlusion. Native T1 values in the thrombus are lower than myocardial T1 values (A). On post-contrast scan (B), T1 values are mildly reduced (680 ms vs 860 ms), probably because of partial volume effect with the blood pool. Corresponding LGE image (C) confirms infarction and thrombi. T1 value is 2100 ms in the pericardial effusion (black star in A) with no change after gadolinium injection.
Figure 13
Figure 13
Large inferior-lateral mass (25 mm thick) in a 21-year-old female with atypical symptoms. T1 mapping shows strongly increased T1 values in this tumor, similar to the blood pool T1 values, in the range of 1354 ms, ie, +31% or +8.3 SD vs remote normal septum. Concomitant high T2 signal pattern (B) and marked LGE in this structure (C) suggest a hyper-vascularized tumor.
Figure 14
Figure 14
Left atrial myxoma in a 60-year-old female. In the T1 maps (A, D), the T1 value of the tumor is increased (≈1350 ms, ie, +25% or +6.9 SD as compared with the septum). High signal of the mass is seen on the corresponding STIR-T2 images (B, E) and in the post-contrast LGE images (heterogeneous pattern in C and F).

References

    1. Salerno M, Kramer CM. Advances in parametric mapping with CMR imaging. JACC Cardiovasc Imaging. 2013;6(7):806–22. - PMC - PubMed
    1. Messroghli DR, Radjenovic A, Kozerke S, Higgins DM, Sivananthan MU, Ridgway JP. Modified Look-Locker inversion recovery (MOLLI) for high-resolution T1 mapping of the heart. Magn Reson Med. 2004;52(1):141–6. - PubMed
    1. Piechnik SK, Ferreira VM, Dall’Armellina E, et al. Shortened Modified Look-Locker Inversion recovery (ShMOLLI) for clinical myocardial T1-mapping at 1.5 and 3 T within a 9 heartbeat breathhold. J Cardiovasc Magn Reson. 2010;19(12):69. - PMC - PubMed
    1. Nagel E, Narula J. Evolution and revolution in CMR imaging. JACC Cardiovasc Imaging. 2013;6(7):837–8. - PubMed
    1. Higgins CB, Herfkens R, Lipton MJ, et al. Nuclear magnetic resonance imaging of acute myocardial infarction in dogs: alterations in magnetic relaxation times. Am J Cardiol. 1983;52(1):184–8. - PubMed

LinkOut - more resources