. 2014 Dec 18;159(7):1563-77.
doi: 10.1016/j.cell.2014.11.037.

Apoptotic caspases prevent the induction of type I interferons by mitochondrial DNA

Affiliations

Apoptotic caspases prevent the induction of type I interferons by mitochondrial DNA

Anthony Rongvaux et al. Cell. .

Abstract

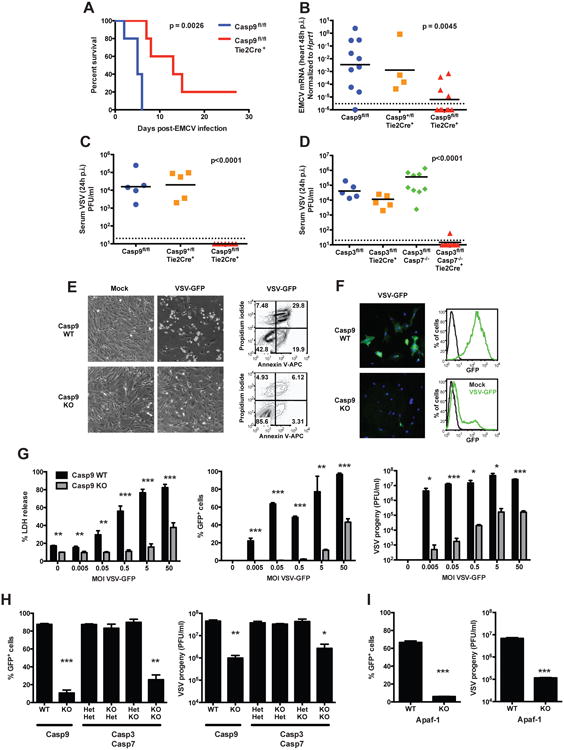
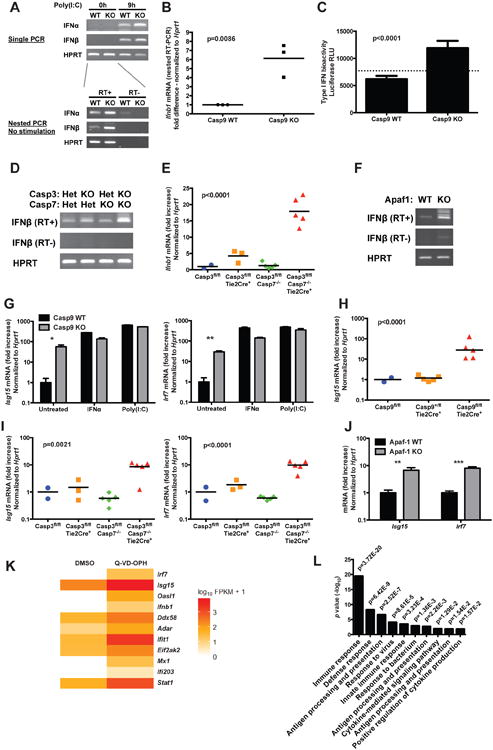
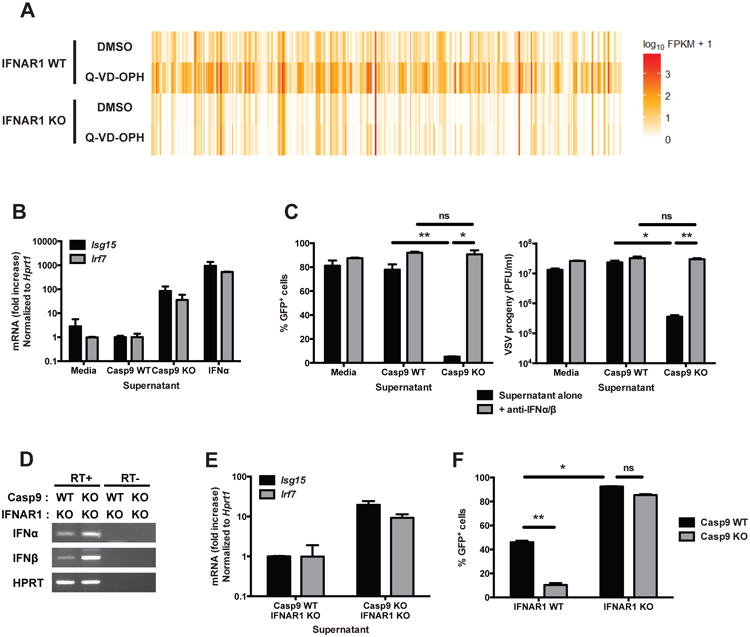
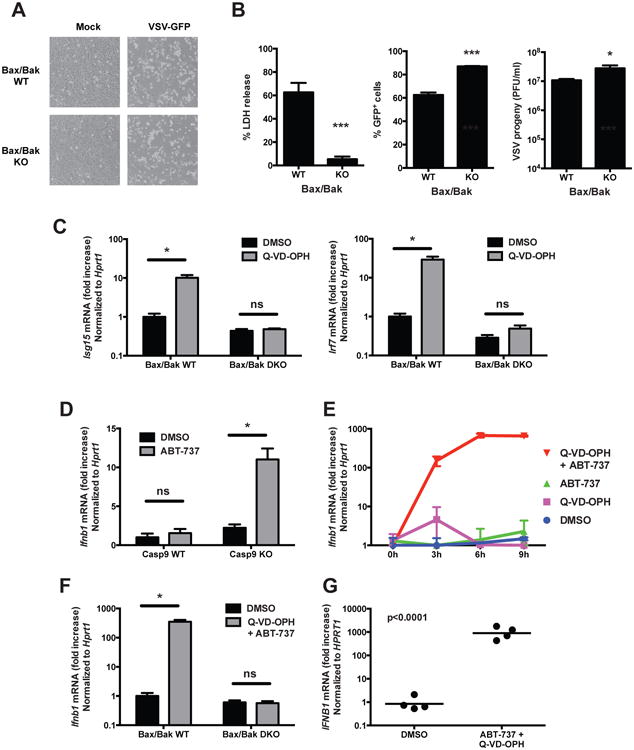
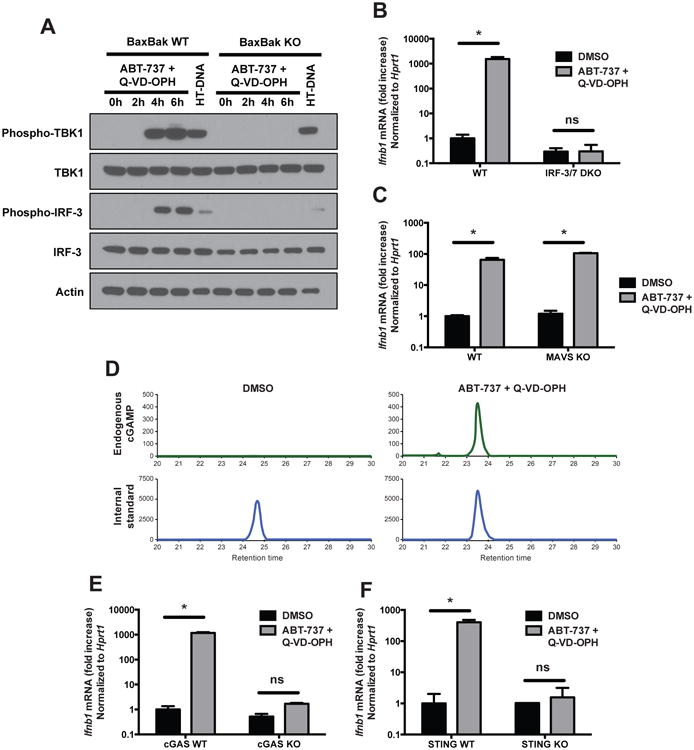
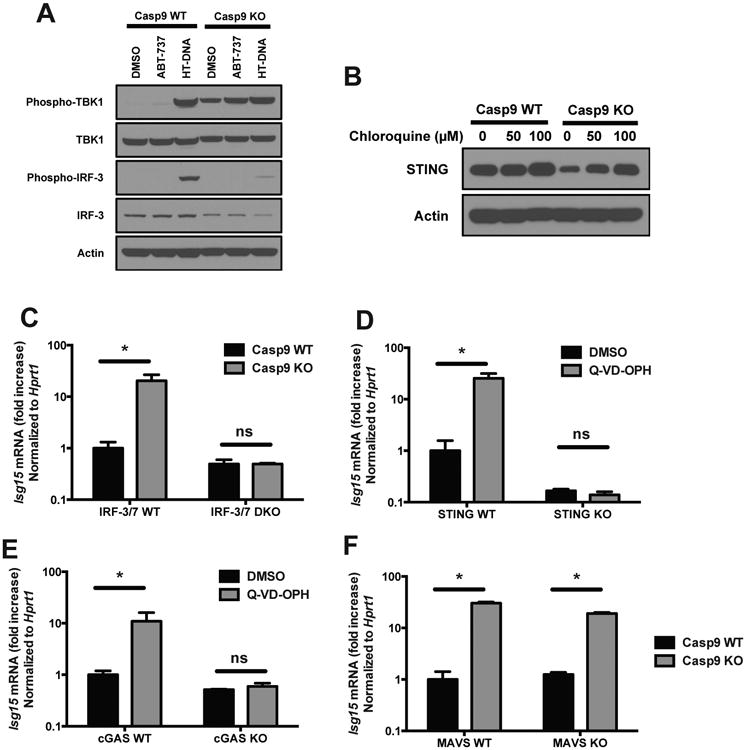
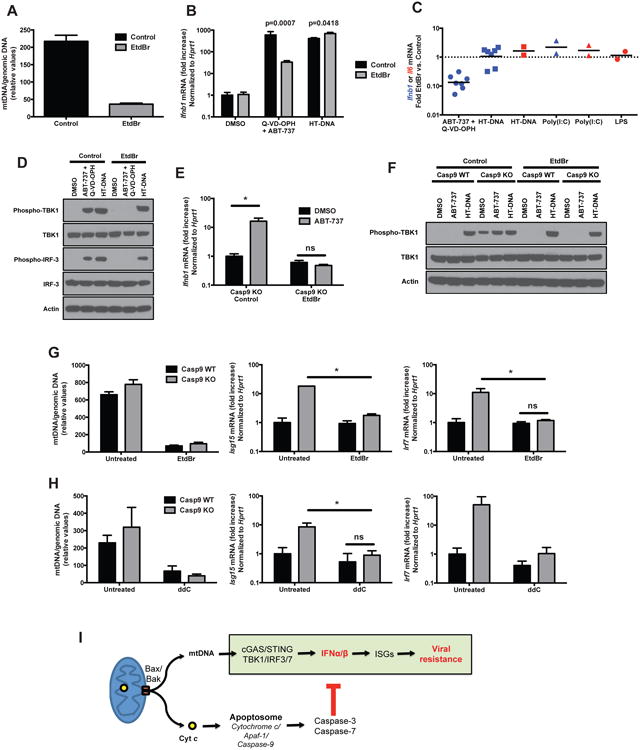
The mechanism by which cells undergo death determines whether dying cells trigger inflammatory responses or remain immunologically silent. Mitochondria play a central role in the induction of cell death, as well as in immune signaling pathways. Here, we identify a mechanism by which mitochondria and downstream proapoptotic caspases regulate the activation of antiviral immunity. In the absence of active caspases, mitochondrial outer membrane permeabilization by Bax and Bak results in the expression of type I interferons (IFNs). This induction is mediated by mitochondrial DNA-dependent activation of the cGAS/STING pathway and results in the establishment of a potent state of viral resistance. Our results show that mitochondria have the capacity to simultaneously expose a cell-intrinsic inducer of the IFN response and to inactivate this response in a caspase-dependent manner. This mechanism provides a dual control, which determines whether mitochondria initiate an immunologically silent or a proinflammatory type of cell death.


Figures

Figure 1
Figure 1. Loss of the intrinsic pathway of apoptosis enhances resistance to viral infection
(A and B) Casp9fl/fl Tie2-Cre+ and control mice were infected intraperitoneally with EMCV (2×10³ TCID50) and the survival was monitored (n=5 mice/group, p-value calculated by Mantel-Cox test) (A); or the mice were sacrificed 48h post-infection (p.i.) and viral loads in the heart were measured by real time RT-PCR (n=4-10 mice/group, combined from 3 independent experiments, p-value calculated by one-way ANOVA) (B). Each symbol represents an individual mouse and the black horizontal bars indicate geometric means. The dashed line indicates the limit of detection of the assay. (C and D) Casp9fl/fl Tie2-Cre+ (C), Casp3fl/fl Casp7-/- Tie2-Cre+ (D) and control mice were infected intranasally with VSV (106 PFU) and sacrificed 24h later. Viral loads were measured in the plasma by plaque forming assay (n=5-7 mice/group, combined from at least 2 independent experiments, p-value calculated by one-way ANOVA). (E and F) Casp9 WT and KO primary MEFs were infected in vitro with VSV-GFP (MOI = 0.5) and analyzed 24h later (E). The expression of virus-encoded GFP was analyzed by fluorescence microscopy (green, GFP; blue, counter-staining of nuclei with DAPI) or by flow cytometry (F). (G) Casp9 WT and KO primary MEFs were infected with the indicated MOI of VSV-GFP, and assessed 24h later for cell death with LDH release assay (left panel), expression of GFP (middle) and viral progeny production by plaque assay (right). Results are presented as mean ± s.d. of triplicates, representative of at least 3 independent experiments. (H and I) Casp3/7 double KO (H) or Apaf-1 KO (I) and respective control primary MEFs were infected with VSV-GFP (MOI = 0.5), and GFP expression and viral progeny were measured as in (G) (mean ± s.d. of duplicates, representative of 2 experiments). *, p<0.05; **, p<0.01; ***, p<0.001 (two-tailed unpaired Student t-test, compared to respective WT or HetHet control). See also Figure S1 and S2.
Figure 2
Figure 2. Inhibition of intrinsic apoptosis activates the IFN response
(A) The expression of IFNα and IFNβ mRNA was determined by RT-PCR in Casp9 WT and KO primary MEFs. Top: single RT-PCR on untreated cells and on cells transfected with poly(I:C) as a positive control. Bottom: nested RT-PCR on untreated cells (RT+, RNA reverse transcribed in cDNA; RT-, no reverse transcription). (B) The steady-state expression of IFNβ mRNA expression in unstimulated primary MEFs was quantified by nested realtime RT-PCR. Each dot represents an independent experiment; p value: two-tailed unpaired Student t-test. (C) Type I IFN bioactivity in the culture supernatant of unstimulated MEFs was measured using an ISRE-Luc reporter cell line (mean ± s.d. of 6 replicates, representative of 2 independent experiments; p value: two-tailed unpaired Student t-test; the dashed line indicates background from untreated reporter cells). (D) Nested RT-PCR amplification of steady state IFNβ in Casp3/7 double deficient and control MEFs. (E) IFNβ mRNA expression measured by realtime RT-PCR in Casp3/7 deficient and control spleen cells (n=2-5 mice/genotype; p value calculated by one-way ANOVA). (F) Nested RT-PCR amplification of steady state IFNβ in Apaf-1 WT and KO MEFs. (G) The expression of selected ISGs in Casp9 WT and KO primary MEFs was measured by realtime RT-PCR. IFNα and intracellular poly(I:C) were used as positive controls (mean ± s.d. of duplicates, representative of at least 5 independent experiments). *, p<0.05; **, p<0.01; ***, p<0.001; two-tailed unpaired Student t-test. (H and I) ISG mRNA expression measured by realtime RT-PCR in Casp9 deficient and control white blood cells (H) or in Casp3/7 double deficient and control spleen cells (I) (n=2-5 mice/genotype; p value: one-way ANOVA). (J) ISG mRNA expression measured by realtime RT-PCR in Apaf-1 WT and KO primary MEFs (mean ± s.d. of triplicates, representative of 3 independent experiments; p value calculated by two-tailed unpaired Student t-test). (K) Heatmap of the expression of IFNβ and selected ISGs in WT primary MEFs stimulated for 48h with vehicle (DMSO) or with the caspase inhibitor Q-VD-OPH (10 μM). (L) Gene Ontology analysis of the pathways overrepresented among genes differentially expressed between WT primary MEFs stimulated with vehicle or with Q-VD-OPH. See also Figure S3 and S5, and Table S1.
Figure 3
Figure 3. Expression of ISGs and antiviral resistance are mediated by type I IFNs
(A) Heatmap of the expression of genes differentially expressed (q<0.05, fold difference >= 5) in IFNAR1 WT and KO primary MEFs stimulated for 48h with vehicle (DMSO) or with the capase inhibitor Q-VD-OPH (10 μM), and determined by RNA sequencing on duplicate samples. (B) Culture supernatants of confluent cultures of Casp9 WT and KO primary MEFs were collected. WT primary MEFs were then incubated for 16h in the presence of these supernatants or of recombinant IFNα (50 U/ml), and the expression level of selected ISGs was measured by realtime RT-PCR (mean ± s.d. of duplicates; representative of 2 independent experiments). (C) WT primary MEFs were incubated for 16 hours with conditioned supernatants from Casp9 WT or KO MEFs, in the presence or absence of anti-IFNα and anti-IFNβ neutralizing antibodies (300 NU/ml each). The cells were then washed, infected with VSV-GFP (MOI = 0.5, 24h) and the expression of GFP (left panel) and viral progeny production (right panel) were measured (mean ± s.d. of triplicates, representative of 3 independent experiments). (D) The expression of IFNα and IFNβ mRNA was detected by nested RT-PCR in unstimulated Casp9 WT/IFNAR1 KO and Casp9 KO/IFNAR1 KO primary MEFs (RT+, RNA reverse transcribed in cDNA; RT-, no reverse transcription). (E) WT primary MEFs were incubated for 16h with conditioned media from Casp9/IFNAR1 WT/KO or KO/KO MEFs, and the expression levels of ISGs were measured by real-time RT-PCR. (F) Casp9/IFNAR1 double KO and control primary MEFs were infected with VSV-GFP (MOI = 0.5, 24h) and the expression of GFP was measured by flow cytometry (mean ± s.d. of duplicates, representative of 3 experiments). *, p<0.05; **, p<0.01; ns, not significant; pairwise comparisons following two-way ANOVA. See also Figure S4 and Tables S1 and S2.
Figure 4
Figure 4. Bax/Bak-dependent induction of the IFN response in the absence of active caspases
(A and B) Bax/Bak double KO and control immortalized MEFs were infected with VSV-GFP (MOI = 0.5) and their morphology was observed by microscopy (A) and cell death, GFP expression and viral progeny production were determined (B) (mean ± s.d. of triplicates, representative of 3 experiments). *, p < 0.05; ***, p < 0.001 (two-tailed unpaired t-test). (C) Bax/Bak WT and double KO MEFs were treated with vehicle (DMSO) or with the caspase inhibitor Q-VD-OPH (10 μM) and the expression of ISGs was measured 48h later by RT-PCR (mean ± s.d. of triplicates, representative of 3 experiments). *, p < 0.05; ns, not significant; pairwise comparisons following two-way ANOVA. (D) Expression of IFNβ mRNA by Casp9 WT and KO immortalized MEFs after 6h of treatment with vehicle (DMSO) or with the Bcl-2 inhibitor ABT-737 (10 μM) (mean ± s.d. of triplicates, representative of 3 independent experiments). (E) Expression of IFNβ mRNA by WT primary MEFs at the indicated time points after stimulation with vehicle (DMSO), Bcl-2 inhibitor (ABT-737, 10 μM), caspase inhibitor (Q-VD-OPH, 10 μM) or both inhibitors (mean ± s.d. of duplicates, representative of 3 independent experiments). (F) Expression of IFNβ mRNA by BaxBak WT and double KO immortalized MEFs after 6h of treatment with vehicle or ABT-737 + Q-VD-OPH (mean ± s.d. of triplicates, representative of 3 independent experiments). (G) Expression of IFNβ mRNA by human PBMCs after 6h of treatment with vehicle or ABT-737 + Q-VD-OPH (n=4 healthy donors, results combined from 2 independent experiments; p value calculated by two-tailed unpaired Student t-test). See also Figure S6.
Figure 5
Figure 5. Activation of the cGAS/STING pathway of IFN induction
(A) Western blot analysis of the phosphorylation of TBK1 and IRF-3 in BaxBak WT and KO cells treated with combined Bcl-2/caspase inhibitors (ABT-737 + Q-VD-OPH, 10 μM each), or transfected with HT-DNA as a positive control (3 μg/ml, 3h). Result representative of 3 independent experiments. (B and C) Expression of IFNβ mRNA by IRF-3/7 double KO (B), MAVS KO (C) and control WT primary MEFs after 6h of treatment with vehicle (DMSO) or with ABT-737 + Q-VD-OPH (mean ± s.d. of triplicates, representative of 2 experiments). *, p<0.05; ns, not significant; pairwise comparisons following two-way ANOVA. (D) cGAMP measurement in cell extracts of WT primary MEFs stimulated for 4h with vehicle (DMSO) or ABT-737 + Q-VD-OPH. Result representative of 2 independent experiments. (E and F) Expression of IFNβ mRNA by cGAS WT and KO bone marrow-derived macrophages (E) and by STING WT and KO primary MEFs (F) after 6h of treatment with vehicle or ABT-737 + Q-VD-OPH (mean ± s.d. of 3 or 2 replicates, respectively). See also Figure S7.
Figure 6
Figure 6. cGAS/STING-dependent constitutive ISG expression in the absence of active caspases
(A) Western blot analysis of the phosphorylation of TBK1 and IRF-3 in Casp9 WT and KO cells treated for 6h with vehicle (DMSO), with the Bcl-2 inhibitor ABT-737 (10 μM), or transfected with HT-DNA as a positive control (3 μg/ml, 3h). Result representative of 3 independent experiments. (B) Western blot analysis of STING in Casp9 WT and KO cells treated for 16h with the indicated concentrations of chloroquine. (C) Caspase-9 KO mice were crossed with IRF-3/7 DKO and the expression of ISGs in embryo heads was measured by RT-PCR. Results shown are mean ± s.d. of 3 embryos for each genotype. (D and E) STING WT and KO primary MEFs (D) or cGAS WT and KO bone marrow-derived macrophages (E) were treated with vehicle (DMSO) or with the caspase inhibitor Q-VD-OPH (10 μM) and ISG expression was measured 48h later by RT-PCR (mean ± s.d. of triplicates, representative of 2 independent experiments). (F) Caspase-9 KO mice were crossed with MAVS KO and the expression of ISGs in embryo heads was measured by RT-PCR. Results shown are mean ± s.d. of 2 embryos for each genotype. *, p<0.05; ns, not significant; pairwise comparisons following two-way ANOVA.
Figure 7
Figure 7. mtDNA mediates the induction of type I IFN expression
(A) Ratio of mitochondrial DNA (dloop) to genomic DNA (Tert) measured by RT-PCR on total extracts of WT immortalized MEFs treated for 4 days in EtdBr (150 ng/ml) and then maintained in culture for 16h without treatment (mean ± s.d. of duplicates, representative of at least 5 independent experiments). (B) WT immortalized MEFs treated with EtdBr (150 ng/ml) as in (A) were stimulated with combined Bcl-2/caspase inhibitors (ABT-737 + Q-VD-OPH, 10 μM each) or transfected HT-DNA (3 μg/ml) for 6h and the expression of IFNβ mRNA was measured by realtime RT-PCR (mean ± s.d. of duplicates). p-values calculated by two-tailed unpaired Student t test. (C) Fold inhibition by EtdBr pre-treament, of the induction of IFNβ (blue symbols) or IL-6 (red symbols) mRNA in cells stimulated with ABT-737 + Q-VD-OPH, transfected with HT-DNA, transfected with poly(I:C) or stimulated with LPS. Each dot represents an individual experiment. (D) Western blot analysis of the phosphorylation of TBK1 and IRF-3 induced by ABT-737 + Q-VD-OPH (10 μM each, 6h), or by transfection of HT-DNA (3 μg/ml, 3h), in control WT immortalized MEFs or in the same cells pre-treated as in (A) with EtdBr (450 ng/ml). Result representative of 3 independent experiments. (E) Casp9 KO immortalized MEFs treated or not with EtdBr (450 ng/ml) as in (A) were stimulated with vehicle (DMSO) or the Bcl-2 inhibitor ABT-737 (10 μM) for 6h and the expression of IFNβ mRNA was measured by realtime RT-PCR (mean ± s.d. of duplicates, representative of 2 independent experiments). (F) Western blot analysis of the phosphorylation of TBK1 after treatment with vehicle (DMSO) or the Bcl-2 inhibitor ABT-737 (10 μM, 6h), or after transfection of HT-DNA (3 μg/ml, 3h), in Casp9 WT and KO immortalized MEFs, pre-treated or not with EtdBr (450 ng/ml) as in (A). Results representative of 3 independent experiments. (G and H) Casp9 WT and KO primary MEFs were treated for 4 days with ethidium bromide (150 ng/ml) (G) or immortalized MEFs were treated for 6 days with dideoxycytidine (ddC, 40 μg/ml) (H). The ratio of mitochodrial to genomic DNA was measured by realtime PCR on total extracts (left panel) and the expression of ISGs was determined by realtime RT-PCR. Results are shown as mean ± s.d. of triplicates, representative of 3 and 2 independent experiments, respectively. (I) Schematic model representation of Bax/Bak-dependent, caspase-regulated activation by mtDNA of the cGAS/STING pathway of type I IFN induction. *, p<0.05; ns, not significant; pairwise comparisons following two-way ANOVA.

Comment in

References

    1. Best SM. Viral subversion of apoptotic enzymes: escape from death row. Annual review of microbiology. 2008;62:171–192. - PMC - PubMed
    1. Cai X, Chiu YH, Chen ZJ. The cGAS-cGAMP-STING Pathway of Cytosolic DNA Sensing and Signaling. Molecular cell. 2014;54:289–296. - PubMed
    1. Callus BA, Vaux DL. Caspase inhibitors: viral, cellular and chemical. Cell death and differentiation. 2007;14:73–78. - PubMed
    1. Chipuk JE, Green DR. Do inducers of apoptosis trigger caspase-independent cell death? Nature reviews Molecular cell biology. 2005;6:268–275. - PubMed
    1. Chipuk JE, Moldoveanu T, Llambi F, Parsons MJ, Green DR. The BCL-2 family reunion. Molecular cell. 2010;37:299–310. - PMC - PubMed

Publication types

Associated data