. 2014 Dec 18;159(7):1591-602.
doi: 10.1016/j.cell.2014.11.020.

Acetate dependence of tumors

Affiliations

Acetate dependence of tumors

Sarah A Comerford et al. Cell. .

Abstract

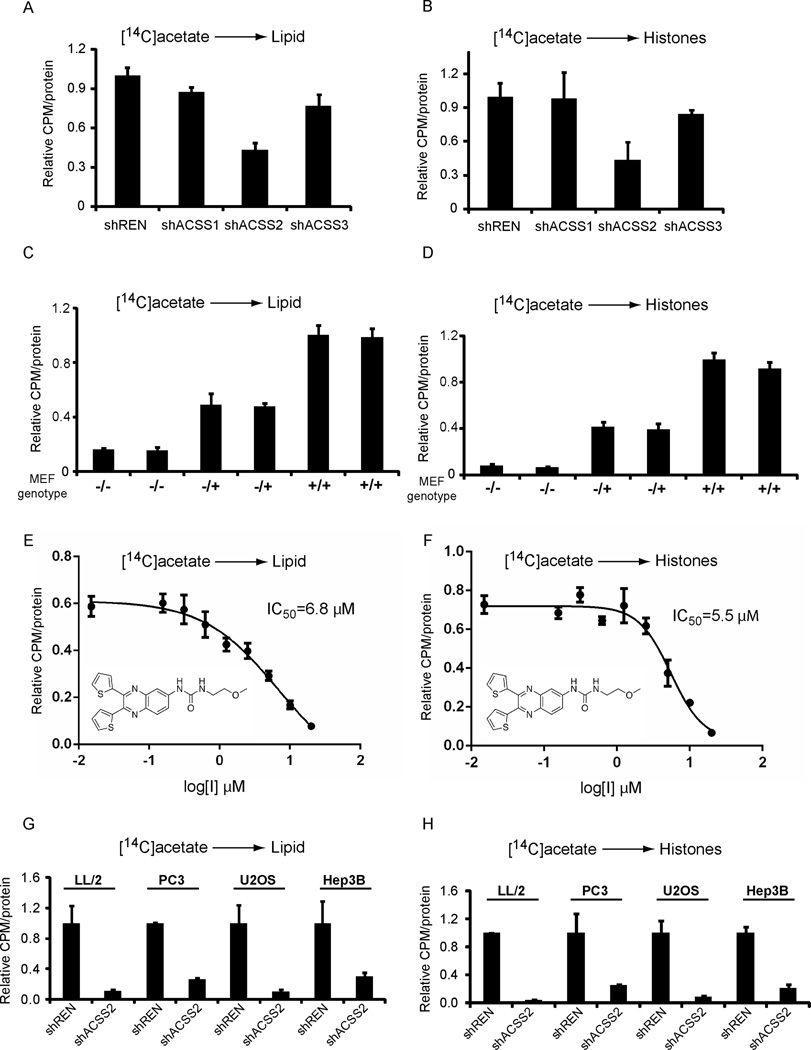
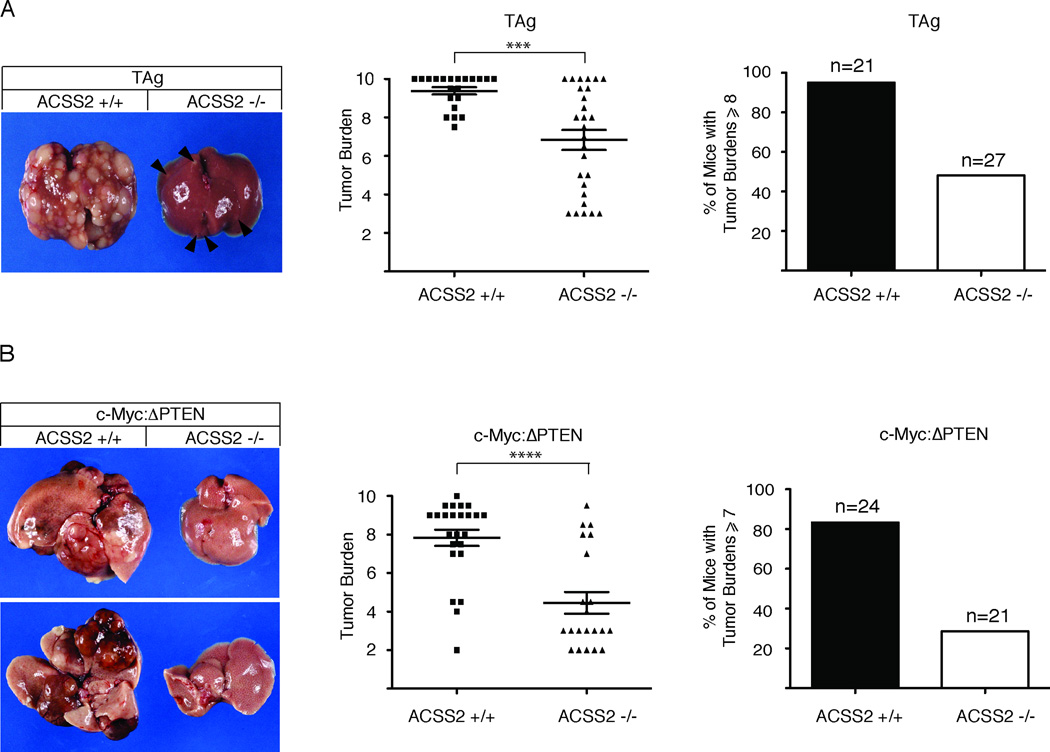
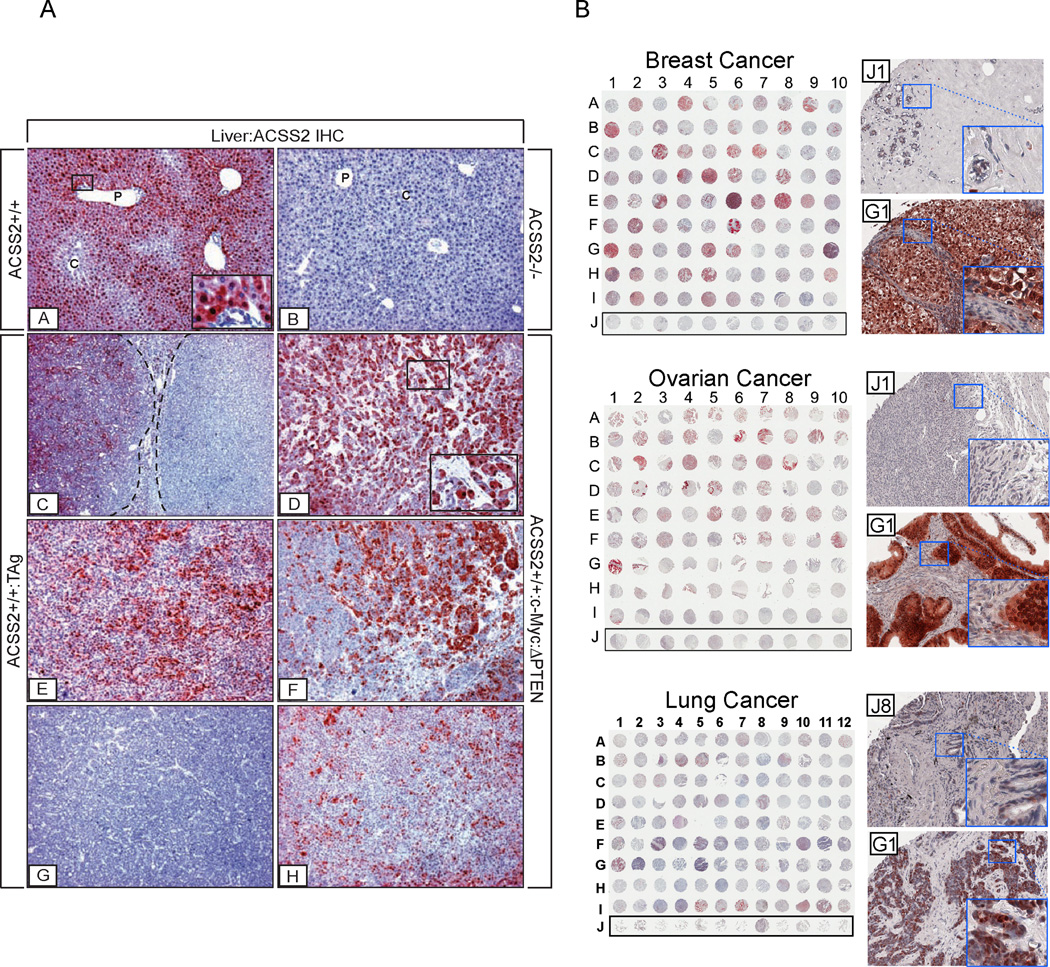
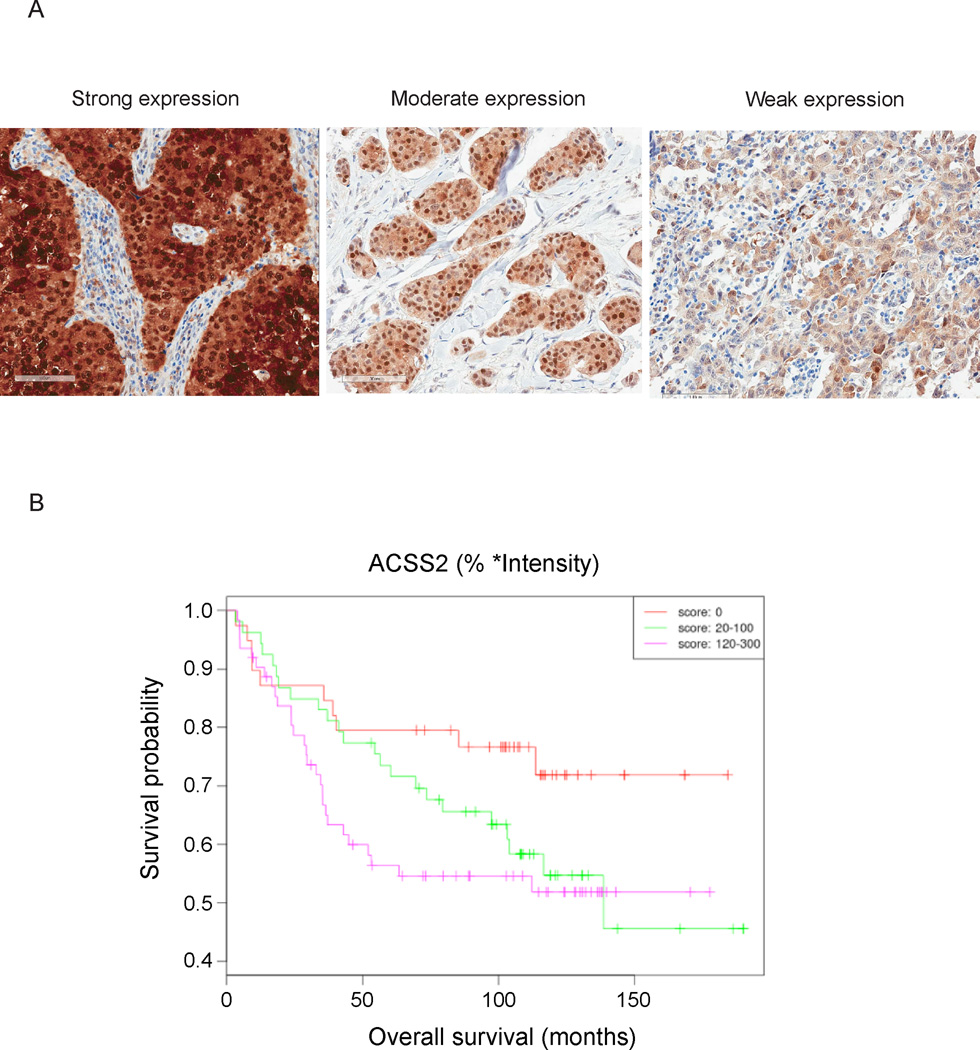
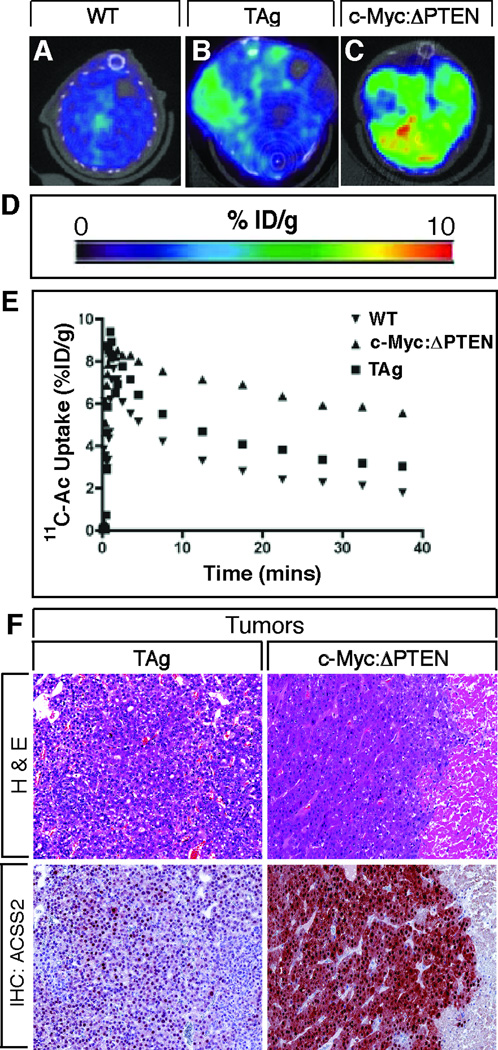
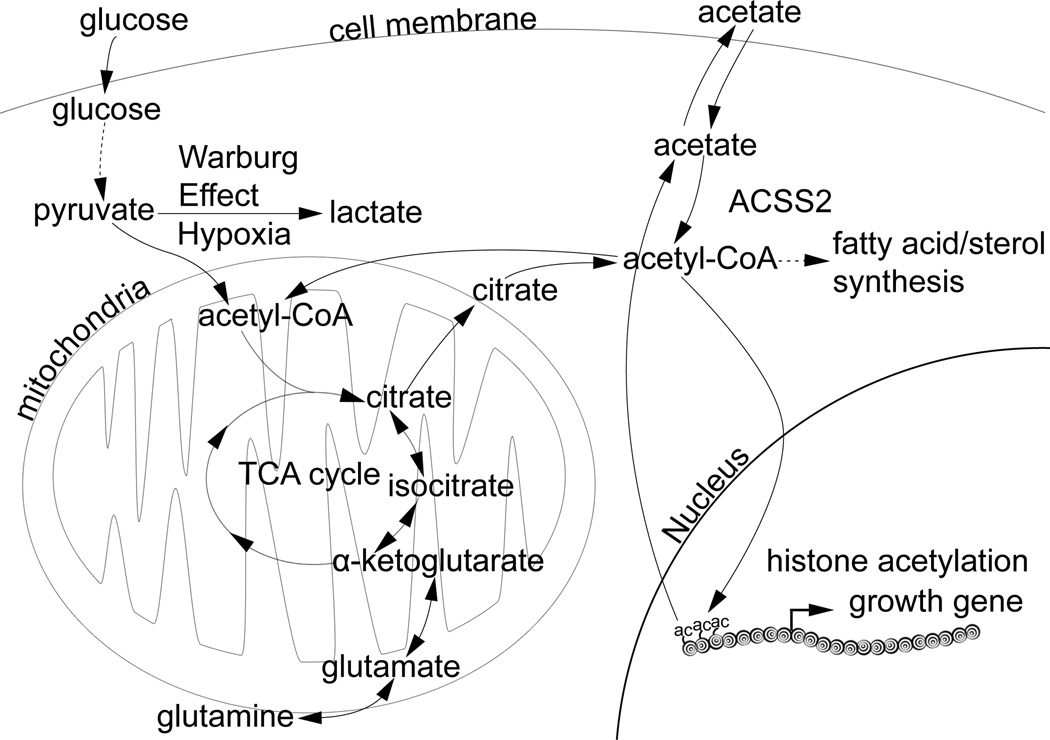
Acetyl-CoA represents a central node of carbon metabolism that plays a key role in bioenergetics, cell proliferation, and the regulation of gene expression. Highly glycolytic or hypoxic tumors must produce sufficient quantities of this metabolite to support cell growth and survival under nutrient-limiting conditions. Here, we show that the nucleocytosolic acetyl-CoA synthetase enzyme, ACSS2, supplies a key source of acetyl-CoA for tumors by capturing acetate as a carbon source. Despite exhibiting no gross deficits in growth or development, adult mice lacking ACSS2 exhibit a significant reduction in tumor burden in two different models of hepatocellular carcinoma. ACSS2 is expressed in a large proportion of human tumors, and its activity is responsible for the majority of cellular acetate uptake into both lipids and histones. These observations may qualify ACSS2 as a targetable metabolic vulnerability of a wide spectrum of tumors.


Figures

Figure 1
Figure 1. ACSS2 is the Major Enzyme Required for Incorporation of Acetate into Lipids and Histones
(A) HepG2 cells with constitutive shRNA knockdown of ACSS1, ACSS2, ACSS3, or control (REN) were assayed for their ability to utilize [14C]acetate for lipid synthesis. Acetate must be converted to acetyl-CoA before it can be utilized as a metabolic substrate. Knockdown efficiency is shown in Figure S1. (B) HepG2 cells with constitutive shRNA knockdown of ACSS1, ACSS2, ACSS3, or control (REN) were assayed for their ability to utilize [14C]acetate for histone acetylation. (C) Mouse embryonic fibroblasts (MEFs) were prepared from ACSS2 WT (+/+), heterozygous (−/+), and KO (−/−) mice, and assayed for their ability to incorporate [14C]acetate into lipid. Note the −/− MEFs show very little [14C]acetate incorporation into lipid fractions. ACSS2 protein levels in the MEFs are shown in Figure S1. (D) MEFs of the indicated genotypes were assayed for their ability to utilize [14C]acetate for histone acetylation. Note the −/− MEFs show very little [14C]acetate incorporation into histones. (E) ACSS2 is druggable. A high-throughput screen was conducted to identify small molecule inhibitors of the human ACSS2 enzyme (Experimental Procedures). The structure of one of the most potent and specific inhibitors, 1-(2,3-di(thiophen-2-yl)quinoxalin-6-yl)-3-(2-methoxyethyl)urea, is shown. This quinoxaline compound inhibited the ability of HepG2 cells to incorporate [14C]acetate into lipids with IC50 = 6.8 µM. (F) The quinoxaline was also able to inhibit HepG2 utilization of [14C]acetate for histone acetylation with IC50 = 5.5 µM. (G) Knockdown of ACSS2 in cancer cell lines significantly reduces acetate incorporation into lipids. [14C]acetate incorporation into lipids was assayed in LL/2, PC3, U2OS, or Hep3B cancer cell lines harboring stable knockdown of ACSS2 or control (REN). Knockdown efficiency is shown in Figure S1. For each cell line, uptake amount was normalized against control. (H) Knockdown of ACSS2 in cancer cell lines significantly reduces acetate incorporation into histones. [14C]acetate incorporation into histones was assayed in cancer cell lines harboring stable knockdown of ACSS2 or control (REN).
Figure 2
Figure 2. Loss of ACSS2 Suppresses Tumor Development
(A) Loss of ACSS2 reduces SV40-TAg-induced liver cancer. Left: Livers of mice treated with dox for 42–45 days to induce TAg-dependent tumorigenesis. The liver from an ACSS2+/+:TAg mouse with a tumor burden score of 9 (left) and the liver from an ACSS2−/−:TAg mouse with a tumor burden score of 4 (right). (Ventral View). Arrows denote small developing tumors. See Table S2 for detailed description of tumor scoring. Center: The distribution of tumor burden scores in livers of ACSS2+/+:TAg and ACSS2−/−:TAg mice after 42–45 days on dox (n=21 and 27 respectively). Loss of ACSS2-reduces the mean tumor burden score from 9.4 to 6.8 (p = 0.0002). Right: Graph showing % of ACSS2+/+:TAg and ACSS2−/−:TAg mice with tumor burden scores of 8 or greater after 42–45 days of dox-treatment (20/21 (95%) and 13/27 (48%) respectively). See also Figure S2. (B) Loss of ACSS2 reduces the incidence of murine liver cancer caused by overexpression of c-Myc in conjunction with loss of PTEN (c-Myc:ΔPTEN). Left: Liver from a 6–7 month old ACSS2+/+:c-Myc:ΔPTEN mouse with a tumor burden score of 8 (left) adjacent to the liver from an ACSS2−/−:c-Myc:ΔPTEN mouse with a tumor burden score of 3 (right). Ventral view, top; dorsal view, bottom. See Table S2 for detailed description of tumor scoring. Center: The distribution of tumor burden scores in livers of ACSS2+/+:c-Myc:ΔPTEN and ACSS2−/−:c-Myc:ΔPTEN mice at 6–7 months of age (n= 24 and 21, respectively). Loss of ACSS2 reduces the mean tumor burden score from 7.8 to 4.7 (p < 0.0001). Right: Graph showing % of ACSS2+/+:c-Myc:ΔPTEN and ACSS2−/−:c-Myc:ΔPTEN mice with tumor burden scores of ≥ 7 at 6–7 months of age (20/24 (83%) and 6/21 (29%), respectively). See also Figure S2.
Figure 3
Figure 3. Immunohistochemical (IHC) Analysis of ACSS2 Expression in Tumors
(A) Expression patterns of ACSS2 protein in normal mouse liver and liver tumors. Insets: [A] ACSS2 IHC on WT liver showing regional expression of ACSS2 across the lobule. ACSS2 is localized to the nucleus/cytoplasm in zone 1 and 2 hepatocytes, but is largely absent from zone 3 hepatocytes and biliary cells. P, portal vein; C, central vein. [B] Complete absence of ACSS2 expression in liver of an ACSS2 −/− mouse. [C], [E], [G] Variability of ACSS2 expression in tumor-laden livers of ApoE-rtTA:TRE2-TAg mice provided with 10 µg/mL doxycycline for 42–45 days. [D], [F], [H] ACSS2 expression in c-Myc:ΔPTEN tumors. AEC chromagen (red); hematoxylin counterstain (blue). [A] ×60 mag, higher mag inset ×366; [B] ×60 mag; [C] ×36 mag; [D] ×60 mag, higher mag inset ×244; [E]–[H] ×60 mag. (B) Survey of ACSS2 expression in human breast, ovarian, and lung tumors. IHC was carried out to assess ACSS2 protein expression in a panel of human breast, ovarian, and lung tumor sections in tissue microarray format. Row J denotes samples of normal, non-cancerous tissue. For each category of tumor, a higher magnification image of one representative example of staining in normal tissue, and one representative example of staining in a high ACSS2-expressing tumor, are shown to the right. Scoring of ACSS2 expression is these TMA samples is indicated in Table S5.
Figure 4
Figure 4. ACSS2 Expression in Triple Negative Breast Cancers
(A) Representative examples of high, medium, and low ACSS2 expression in triple negative breast cancers. The complete TMA staining is shown in Figure S3. (B) High expression of ACSS2 was associated with poorer overall survival (p = 0.03).
Figure 5
Figure 5. [11C]Acetate Uptake Correlates with ACSS2 Expression in HCC Driven by TAg or Combined Overexpression of c-Myc and Loss of PTEN
(A–C) Combined [11C]acetate PET/CT of WT (A), TAg (B) and c-Myc:ΔPTEN (C) mice (Transverse views). (D) Scale (%ID/g) of avidity of [11C]acetate uptake. (E) Time activity curve (TAC) of 40 minute dynamic PET scan of [11C]acetate uptake in WT, TAg and c-Myc:ΔPTEN mice shown in A–C. (F) Photomicrographs (× 125 magnification) of H & E (top) and corresponding ACSS2 IHC (bottom) of tumors from TAg (left hand panels) and c-Myc:ΔPTEN (right hand panels) mice shown in B and C. ACSS2 staining (red/brown color) is predominantly nuclear in the poorly differentiated tumor in the TAg mouse (left) but is both nuclear and cytoplasmic in the moderately differentiated trabecular HCC in the c-Myc:ΔPTEN mouse (right). See also Figure S4.
Figure 6
Figure 6. Acetate is a Critical Source of Acetyl-CoA for Certain Tumors
Schematic diagram depicting the pathways that synthesize and consume acetyl-CoA in mammalian cells. Hypoxic or highly glycolytic cancer cells preferentially shunt pyruvate to lactate, instead of to acetyl-CoA via the pyruvate dehydrogenase complex, raising the question of how such cells obtain sufficient quantities of acetyl-CoA. Among numerous metabolic functions, acetyl-CoA is used for fatty acid/sterol synthesis, histone acetylation, the synthesis of glutamate (related paper in this issue), or further oxidation via the TCA cycle for ATP synthesis. Glutamine can reportedly serve as a source of acetyl-CoA in cell culture studies. Acetate is an overlooked source of acetyl-CoA and can be produced as a result of histone or protein deacetylation, or from the action of acetyl-CoA thioesterase/hydrolase enzymes. The nucleocytosolic acetyl-CoA synthetase enzyme ACSS2 enables the recapture of acetate to acetyl-CoA that can subsequently be utilized for the indicated metabolic processes, all of which are expected to support tumor growth or survival.

References

    1. Ariyannur PS, Moffett JR, Madhavarao CN, Arun P, Vishnu N, Jacobowitz DM, Hallows WC, Denu JM, Namboodiri AM. Nuclear-cytoplasmic localization of acetyl coenzyme a synthetase-1 in the rat brain. The Journal of comparative neurology. 2010;518:2952–2977. - PMC - PubMed
    1. Berg P. Acyl adenylates; an enzymatic mechanism of acetate activation. J Biol Chem. 1956;222:991–1013. - PubMed
    1. Blount ZD, Barrick JE, Davidson CJ, Lenski RE. Genomic analysis of a key innovation in an experimental Escherichia coli population. Nature. 2012;489:513–518. - PMC - PubMed
    1. Cai L, Sutter BM, Li B, Tu BP. Acetyl-CoA Induces Cell Growth and Proliferation by Promoting the Acetylation of Histones at Growth Genes. Mol Cell. 2011;42:426–437. - PMC - PubMed
    1. Cai L, Tu BP. On Acetyl-CoA as a Gauge of Cellular Metabolic State. Cold Spring Harb Symp Quant Biol. 2011;76:195–202. - PubMed

Publication types