. 2014 Dec 18;159(7):1603-14.
doi: 10.1016/j.cell.2014.11.025.

Acetate is a bioenergetic substrate for human glioblastoma and brain metastases

Affiliations

Acetate is a bioenergetic substrate for human glioblastoma and brain metastases

Tomoyuki Mashimo et al. Cell. .

Abstract

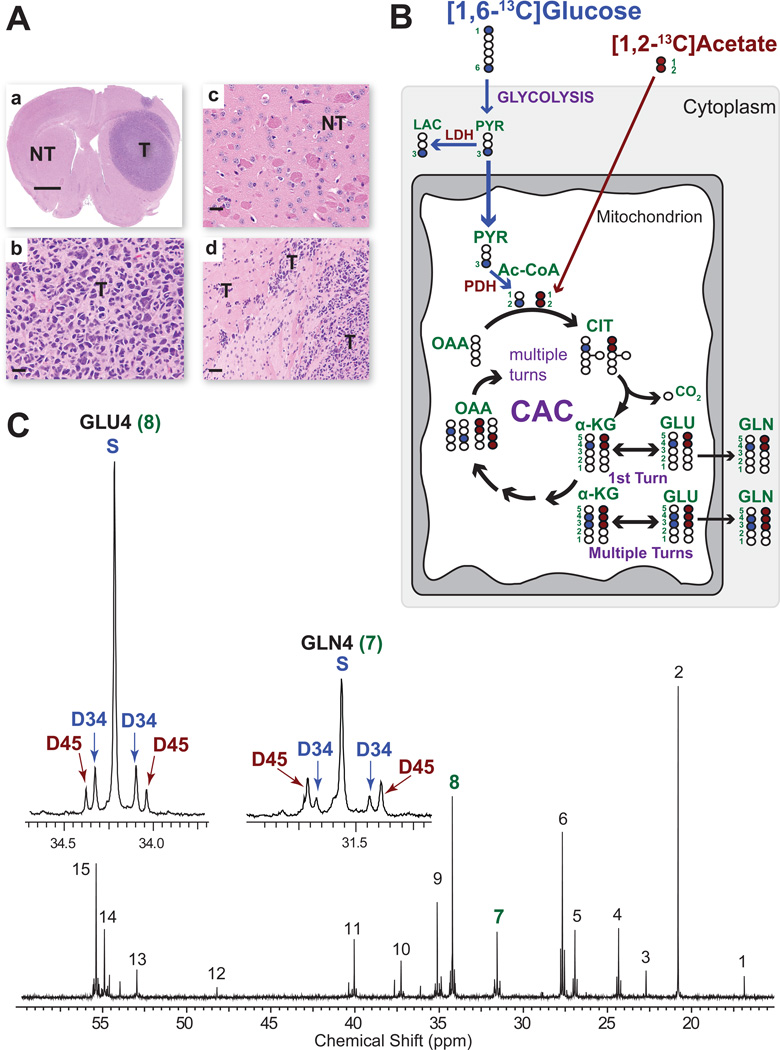
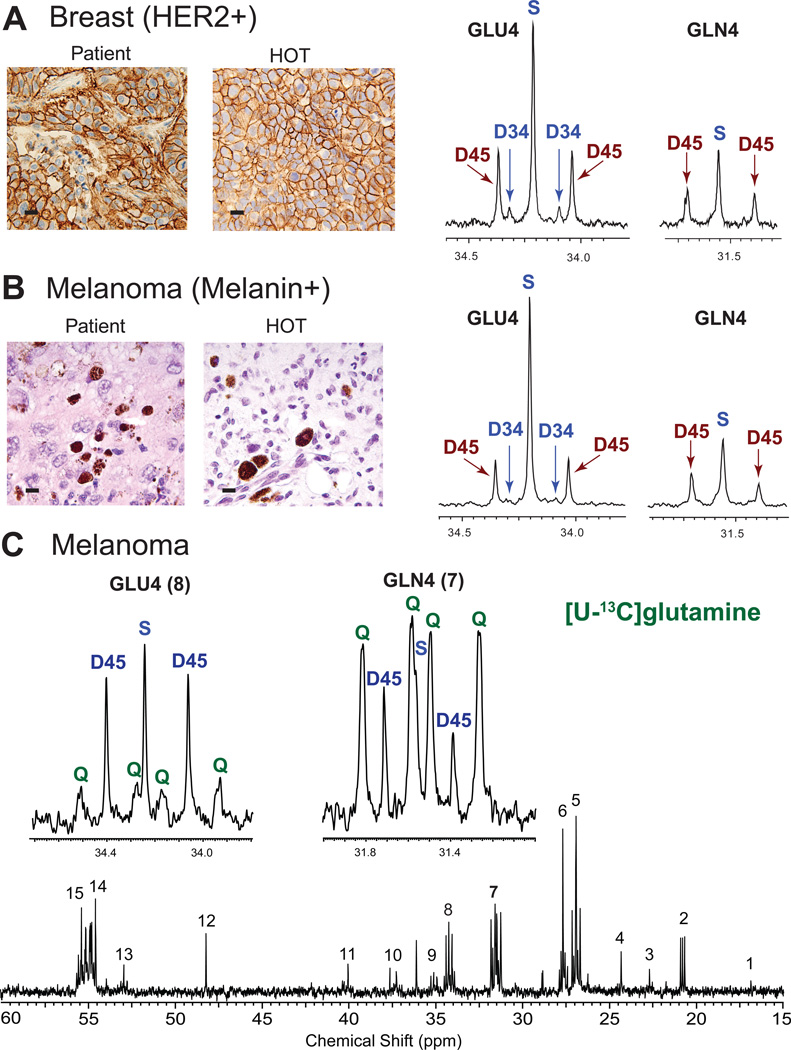
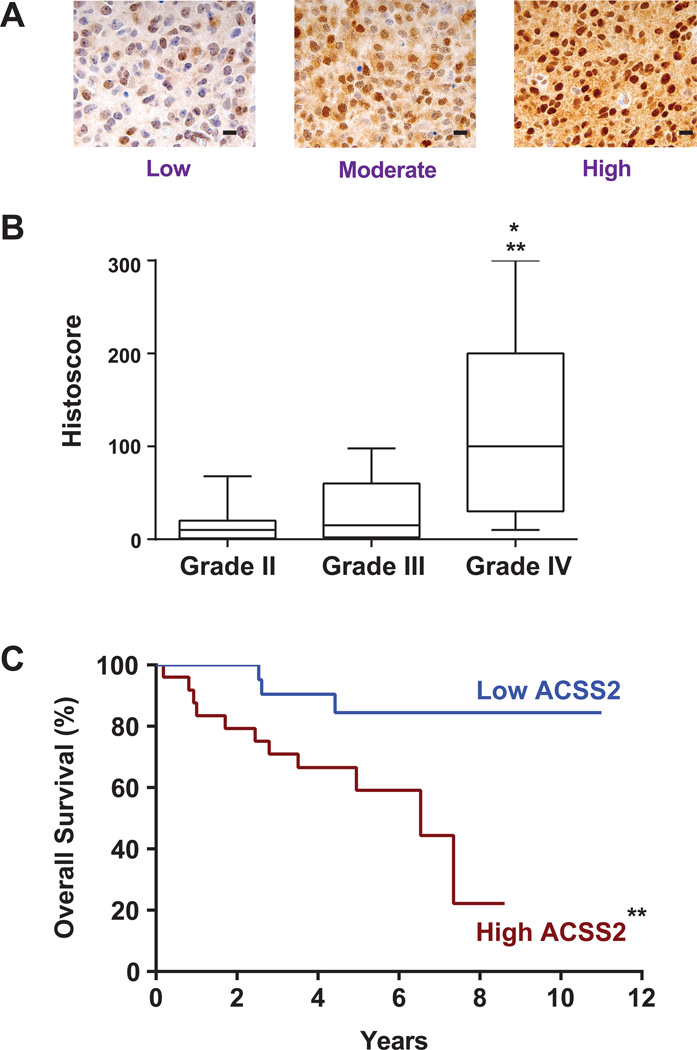
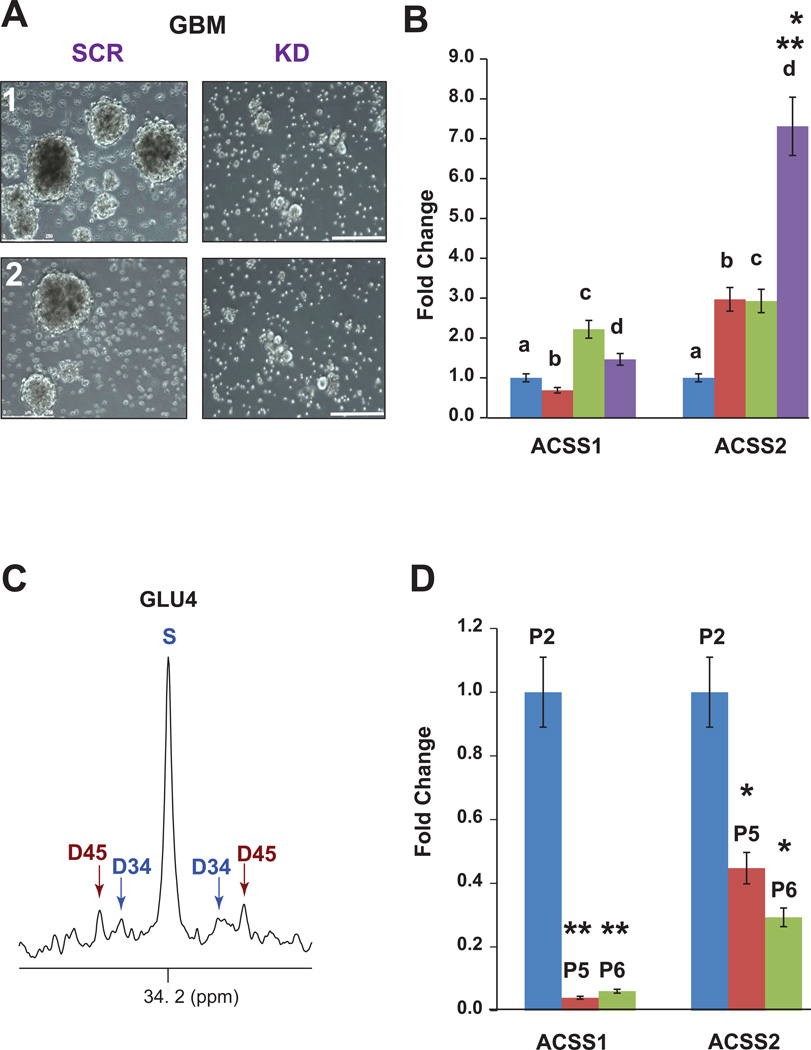
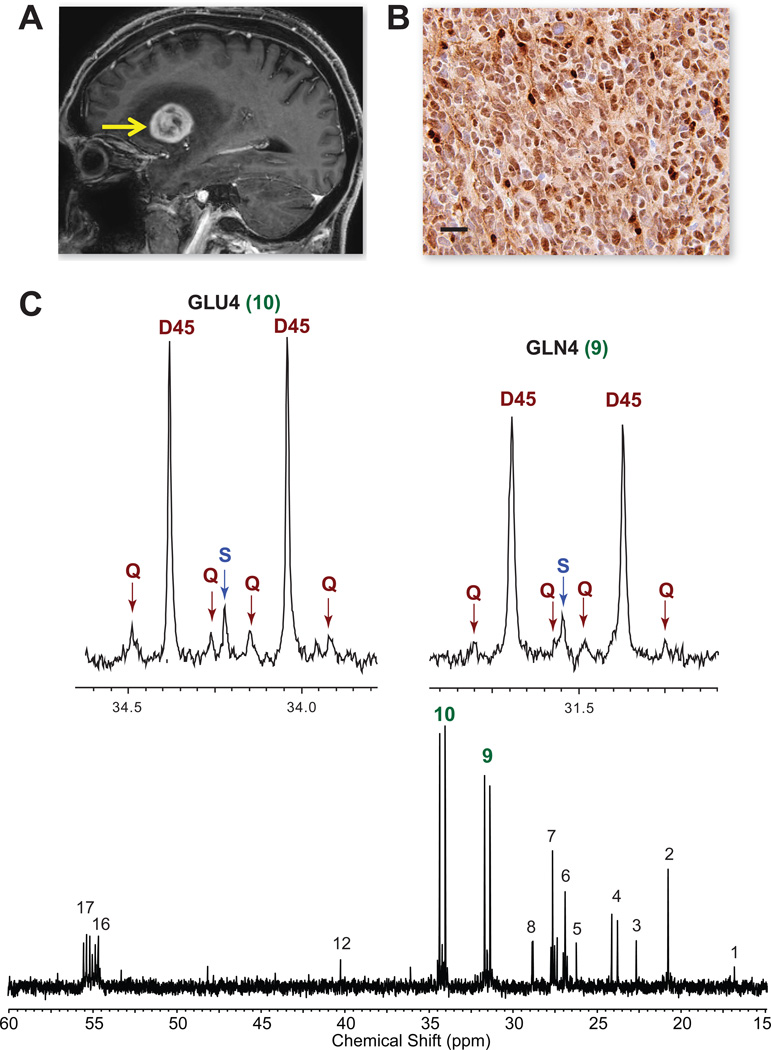
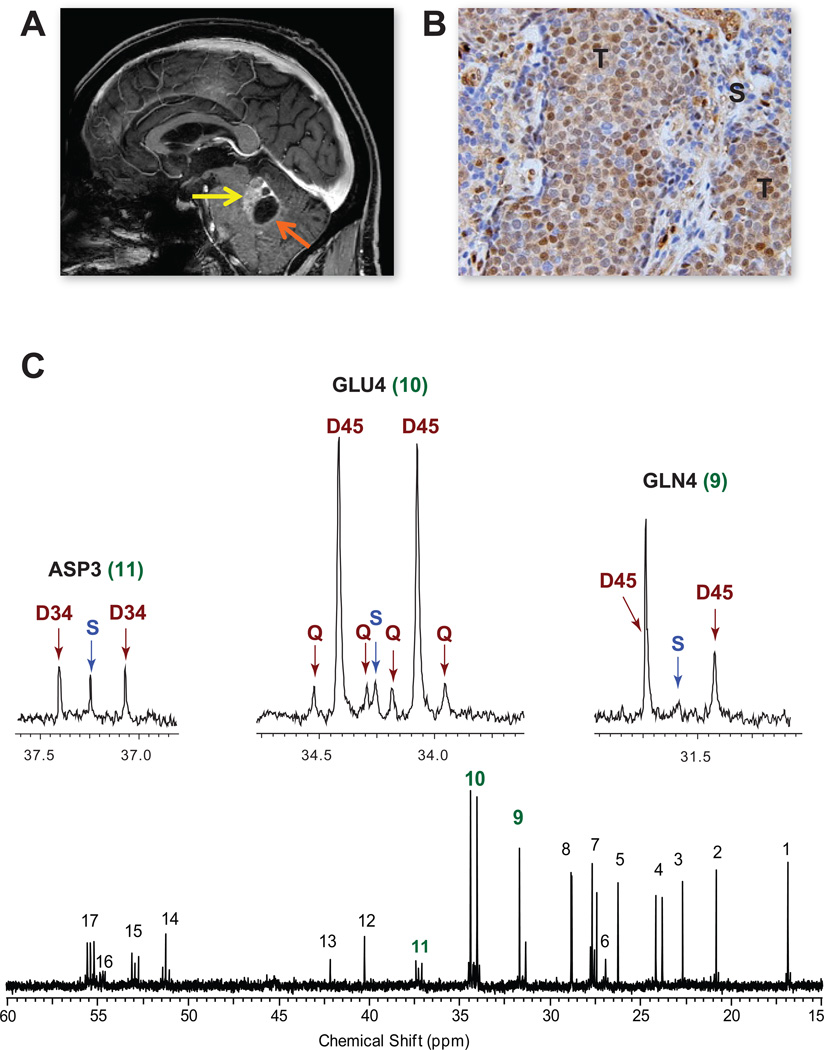
Glioblastomas and brain metastases are highly proliferative brain tumors with short survival times. Previously, using (13)C-NMR analysis of brain tumors resected from patients during infusion of (13)C-glucose, we demonstrated that there is robust oxidation of glucose in the citric acid cycle, yet glucose contributes less than 50% of the carbons to the acetyl-CoA pool. Here, we show that primary and metastatic mouse orthotopic brain tumors have the capacity to oxidize [1,2-(13)C]acetate and can do so while simultaneously oxidizing [1,6-(13)C]glucose. The tumors do not oxidize [U-(13)C]glutamine. In vivo oxidation of [1,2-(13)C]acetate was validated in brain tumor patients and was correlated with expression of acetyl-CoA synthetase enzyme 2, ACSS2. Together, the data demonstrate a strikingly common metabolic phenotype in diverse brain tumors that includes the ability to oxidize acetate in the citric acid cycle. This adaptation may be important for meeting the high biosynthetic and bioenergetic demands of malignant growth.


Figures

Figure 1
Figure 1. Metabolism of co-infused [1,6-13C]glucose and [1,2-13C]acetate
(A) Low power hematoxylin & eosin (H&E) of a GBM HOT mouse brain at the time of co-infusion. (a) A large tumor (T) mass is seen in the right hemisphere. The left hemisphere is designated non-tumor (NT) brain. Scale bar 0.3 cm. High power images from (b) tumor (T) and (c) NT brain (scale bars 10 µm), and (d) tumor infiltrating brain at the edge of the mass (scale bar 20 µm). (B) Schema showing the fate of individual carbons from infused [1,6-13C]glucose (blue filled circles-13C) and [1,2-13C]acetate (red filled circles-13C) through the first turn of the CAC and labeling in α-KG, GLU and GLN after multiple turns. Open circles 12C. Numbers refer to carbon positions. Abbreviations: LAC, lactate; Ac-CoA, acetyl CoA; CIT, citrate; α-KG, α- ketoglutarate; GLU, glutamate; GLN, glutamine; OAA, oxaloacetate; PDH, pyruvate dehydrogenase; LDH, lactate dehydrogenase; PYR, pyruvate. (C) 13C-NMR spectrum from NT brain after co-infusion. Insets are GLU4 and GLN4. Singlet (S) and doublet 3,4 (D34) in blue are generated from 13C-glucose metabolism and doublets 4,5 (D45) in red are generated from 13C-acetate metabolism. The color scheme is the same in all figures. Chemical shift assignments: 1, Alanine C3; 2, Lactate C3; 3, N-acetylaspartate C6; 4, GABA C3; 5, Glutamine C3; 6, Glutamate C3; 7, Glutamine C4; 8, Glutamate C4; 9, GABA C2; 10, Aspartate C3; 11, GABA C4; 12, Taurine (?); 13, Aspartate C2; 14, Glutamine C2; 15, Glutamate C2.
Figure 2
Figure 2. Metabolism of co-infused [1,6-13C]glucose and [1,2-13C]acetate in GBM vs NT brain
(A) 13C-NMR GBM tumor spectrum after co-infusion. Inserts are GLU4 and GLN4. Chemical shift assignments same as in Figure 1. (B) Relative percent labeling of GLU4 by acetate and glucose in 5 replicates of NT brain and T from UT-GBM1. Peak areas in GLU4 were measured from the 13C-NMR spectra. The contribution of 13C-glucose (S+D34) (blue bars) and 13C-acetate (D45+Q) (red bars) are expressed as percent of total peak area in GLU4. See also Figure S1.
Figure 3
Figure 3. Oxidation of 13C-acetate but not 13C-glutamine in brain metastases
Co-infusion of [1,6-13C]glucose and [1,2-13C]acetate in HOT models from (A) Breast cancer brain metastasis (ER+, PR+, HER2+) and (B) Melanoma (BRAFV600E mutant). Scale bars 10 µm. Patient tumor (left panel) is compared with the HOT mouse tumor generated from the same patient tumor (right panel) for HER2 in breast (A) and melanin in melanoma (B). The GLU4 and GLN4 13C-NMR profiles from the HOT tumors show similar labeling patterns with prominent D45 generated from 13C-acetate oxidation. The presence of S and D34 indicates that 13C-glucose was oxidized simultaneously. Note the similar pattern in GLN4 (prominent D45) in both tumor spectra. (C) Infusion of [U-13C]glutamine in the melanoma HOT model. Insets are GLU4 and GLN4. Note the different labeling pattern in GLU4 and GLN4. Prominent labeling was not detected in aspartate (C3 in position 10 and C2 in position 13 in the full spectrum) or malate (MAL) (unlabeled). See also Figure S2.
Figure 4
Figure 4. Immunoreactivity to ACSS2 is correlated with glioma grade and survival of grade II and II gliomas
(A) Representative sections from glioma TMA showing the range of ACSS2 staining. Low – fewer than 50% of tumor cells are positive and intensity of staining is 1 (scale 0–3); Moderate – 75% positive, intensity 1–3; High – 100% positive and intensity 2–3. (B) Box and whisker plot of ACSS2 histoscore for WHO Grades II, III, and IV gliomas. ** Grade II vs Grade IV (p<0.001) and *Grade III vs Grade IV (p<0.01). (C) Kaplan-Meier curve of Grade II and III astrocytomas and oligoastrocytomas. High vs low ACSS2 staining (n=25 each group) based on the median histoscore. **p<0.001 survival difference. See also Figure S3A for ACSS2 immunoreactivity in brain metastasis HOT lines.
Figure 5
Figure 5. Expression of ACSS2 is linked to GBM growth and malignant potential
(A) Comparison of primary GBM cultures infected with retroviruses expressing ACSS2 shRNAi (KD) or scrambled shRNAi (SCR). Two independent cultures are shown. Neurospheres are visible in the SCR cultures but not in KD cultures. Scale bars 250 µm. (B) Fold change (qRT-PCR) of ACSS1 and ACSS2 mRNA in primary conditional (floxed) astrocyte cultures after infection with adenocre to produce (a) p53−/−, (b) p53−/−, PTEN−/−, (c) p53+/−, PTEN−/−, BRAFV600E and (d) p53−/−, PTEN−/−, BRAFV600E. *p<0.01 vs b or c; **p<0.001 vs a. C. Glutamate C4 multiplets from 13C-NMR spectrum of an intracranial tumor arising from p53−/−, PTEN−/−, BRAFV600E astrocytes after co-infusion of 13C-acetate and 13C-glucose. D. Fold change (qRT-PCR) of ACSS1 and ACSS2 mRNA in primary astrocytes in culture at passages 2 (P2), 5 (P5), and 6 (P6). *p<0.01, ** p<0.005 vs P2. See also Figure S3B.
Figure 6
Figure 6. Oxidation of [1,213C]-acetate in a patient with GBM
(A) Pre-operative sagittal image from gadolinium-enhanced MRI shows a large enhancing tumor in the left frontotemporal region (arrow). (B) Strong ACSS2 immunoreactivity in the tumor. Scale bar 10 µm. (C) 13C-NMR spectrum with GLU4 and GLN4 insets. Note the prominent D45 and Qs reflecting robust 13C-acetate oxidation. Abbreviations same as Figure 2. Chemical shift assignments: 1, Alanine C3; 2, Lactate C3; 3, N-acetylaspartate C6; 4, Acetate C2; 5, unassigned; 6, Glutamine C3; 7, Glutamate C3; 8, unassigned; 9, Glutamine C4; 10, Glutamate C4; 12, N-acetylaspartate C3; 16, Glutamine C2; 17, Glutamate C2.
Figure 7
Figure 7. Infusion of [1,213C]acetate in a patient with a non-small cell lung cancer brain metastasis
(A) Pre-operative MRI, sagittal image, shows a gadolinium-enhancing tumor in the left cerebellum (yellow arrow) with a cystic component (orange arrow). (B) Moderate ACSS2 immunoreactivity in the tumor (T) with lack of staining in the surrounding stroma (S). Scale bar 10 um. (C) 13C-NMR spectrum with GLU4, GLN4 and ASP3 insets. Abbreviations same as Figure 2. Chemical shift assignments same as in Figure 6 with the addition of 11, Aspartate C3; 13, Glycine C2; 14, Alanine C2; and 15, Aspartate C2. See also Figure S4 for 13C-spectra from 2 additional patient tumors.

References

    1. Bachoo RM, Maher EA, Ligon KL, Sharpless NE, Chan SS, You MJ, Tang Y, DeFrances J, Stover E, Weissleder R, et al. Epidermal growth factor receptor and Ink4a/Arf: convergent mechanisms governing terminal differentiation and transformation along the neural stem cell to astrocyte axis. Cancer Cell. 2002;1:269–277. - PubMed
    1. Bartnik-Olson BL, Oyoyo U, Hovda DA, Sutton RL. Astrocyte oxidative metabolism and metabolite trafficking after fluid percussion brain injury in adult rats. Journal of neurotrauma. 2010;27:2191–2202. - PMC - PubMed
    1. Brennan CW, Verhaak RG, McKenna A, Campos B, Noushmehr H, Salama SR, Zheng S, Chakravarty D, Sanborn JZ, Berman SH, et al. The somatic genomic landscape of glioblastoma. Cell. 2013;155:462–477. - PMC - PubMed
    1. Comerford S, Huang Z, Du X, Wang Y, Cai L, Witkiewicz A, Walters H, Tantawy M, Fu A, Manning H, et al. Acetate Dependence of Tumors. Cell. 2014 In Press. - PMC - PubMed
    1. Deelchand DK, Nelson C, Shestov AA, Ugurbil K, Henry PG. Simultaneous measurement of neuronal and glial metabolism in rat brain in vivo using co-infusion of [1,6-13C2]glucose and [1,2-13C2]acetate. J Magn Reson. 2009;196:157–163. - PMC - PubMed

Publication types