. 2015 Feb;7(2):309-21.
doi: 10.1039/c4mt00246f.

ApoHRP-based assay to measure intracellular regulatory heme

Affiliations

ApoHRP-based assay to measure intracellular regulatory heme

Hani Atamna et al. Metallomics. 2015 Feb.

Abstract

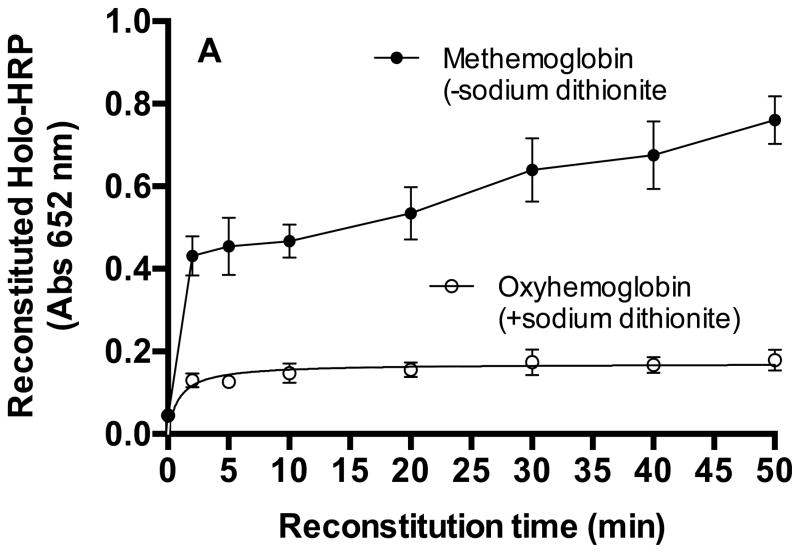
The majority of the heme-binding proteins possess a "heme-pocket" that stably binds to heme. Usually known as housekeeping heme-proteins, they participate in a variety of metabolic reactions (e.g., catalase). Heme also binds with lower affinity to the "Heme-Regulatory Motifs" (HRM) in specific regulatory proteins. This type of heme binding is known as exchangeable or regulatory heme (RH). Heme binding to HRM proteins regulates their function (e.g., Bach1). Although there are well-established methods for assaying total cellular heme (e.g., heme-proteins plus RH), currently there is no method available for measuring RH independent of the total heme (TH). The current study describes and validates a new method to measure intracellular RH. This method is based on the reconstitution of apo-horseradish peroxidase (apoHRP) with heme to form holoHRP. The resulting holoHRP activity is then measured with a colorimetric substrate. The results show that apoHRP specifically binds RH but not with heme from housekeeping heme-proteins. The RH assay detects intracellular RH. Furthermore, using conditions that create positive (hemin) or negative (N-methyl protoporphyrin IX) controls for heme in normal human fibroblasts (IMR90), the RH assay shows that RH is dynamic and independent of TH. We also demonstrated that short-term exposure to subcytotoxic concentrations of lead (Pb), mercury (Hg), or amyloid-β (Aβ) significantly alters intracellular RH with little effect on TH. In conclusion the RH assay is an effective assay to investigate intracellular RH concentration and demonstrates that RH represents ∼6% of total heme in IMR90 cells.


Conflict of interest statement

The author has no conflict of interest with the data presented in this study.

Figures

Figure 1
Figure 1. The time and the dose-dependent reconstitutions of apoHRP with hemin
ApoHRP was mixed with hemin in PBS at final concentrations of 5 μM and 2.5 nM, respectively, as described in Table 1. At different time points a sample was removed and the resulting enzymatic activity of holoHRP was measured using the TMB assay kit and presented as absorbance at 652 nm. (A) The time-dependent reconstitution of apoHRP with hemin. The resulting absorbance at 652 nm from holoHRP activity was plotted against the reconstitution time (min) using one-binding site hyperbola (Prism 6.0 software, GraphPad, San Diego, CA, USA). The data are the mean ± sem of four different experiments. (B) The dose-dependent reconstitution of apoHRP with increasing concentrations of hemin. ApoHRP (5μM) was mixed with increasing concentrations of hemin (0–2.5 nM) in PBS as described in Table 1. The resulting activity of holoHRP was measured using the TMB assay kit and the absorbance at 652 nm was plotted against the respective concentration of hemin. Linear regression analysis of the data shows R2 = 0.98 (Prism 6.0 software, GraphPad, San Diego, CA, USA). The data are the mean ± SD of triplicates of the representative experiment.
Figure 2
Figure 2. The time-dependent reconstitution of apoHRP with specific housekeeping hemeproteins
The transfer of the heme moiety of hemoglobin (60 nM), methemoglobin (60 nM), catalase (60 nM), or heme proteins from the lysate (10 μg) to apoHRP was investigated using the RH assay as described in Table 1, except hemin was replaced with the respective heme-protein as descried in the Methods section. The resulting enzymatic activity of holoHRP was measured using the TMB assay kit. HoloHRP activity (as absorbance at 652 nm) was plotted against the reconstitution time using one-binding site hyperbola (Prism 6.0 software, GraphPad, San Diego, CA, USA). (A) MetHb (Closed circles, − sodium dithionite), hemoglobin (Hb-O2, Open circles, + sodium dithionite); (B) Catalase; and (C) heme-proteins from cell-free lysate. Shown the mean ± sem of at least three different experiments for each condition.
Figure 3
Figure 3. The dependence of the RH assay on apoHRP and protein concentrations
(A) Increasing concentrations of apoHRP (0.5 to 6 μM) were incubated with 10 μg protein from the cell-free lysate for 10 min. The resulting holoHRP activity at 652 nM was converted to RH content using standard curve similar to the one described in figure 1B. The data was plotted against apoHRP concentration (Prism 6.0 software, GraphPad, San Diego, CA, USA). (B) Different protein concentrations (5–60 μg) from lysate were mixed with 5 μM apoHRP for 10 min. The resulting holoHRP activity was converted to RH concentration using a standard curve similar to the one presented in Figure 1B and as described in Materials and Methods. The calculated RH/mg protein was then plotted against the protein concentration using linear regression (Prism 6.0 software, GraphPad, San Diego, CA, USA). Shown the mean ± sem of four different experiments for A and B.
Figure 4
Figure 4. The effect of inhibiting heme synthesis or adding hemin to the growth medium on intracellular RH
The time-dependent effect (0.5 to 72 hr) of inhibiting heme synthesis with 8 μM N-methyl protoporphyrin IX (NMP) on RH and total heme was determined in the cellular lysate using HPLC as described in Table 1 and the Methods. (A) Shows the linear regression analysis of the effect of NMP on total heme. (B) Shows the plot of the effect of NMP on RH using best-fit one-phase exponential decay. The data are the mean ± sem of three independent experiments. *P<0.01, **P<0.001, ***p<0.0001, One-way ANOVA test using Dunnett’s multiple comparisons. (C) The dose-dependent effect of adding hemin (0.5 to 6 μM) to the growth medium of IMR90 cell culture for 45 min. After washing hemin, the cells were harvested, the lysate was prepared, and the RH content was measured as described Materials and Methods. **P<0.001, One-way ANOVA test using Dunnett’s multiple comparisons. Shown is the mean ± sem of three independent experiments.
Figure 5
Figure 5. The effect of lead and mercury on regulatory and total heme
IMR90 cell cultures were incubated for 24 hr with increasing concentrations of Pb (250 to 1000nM) or Hg (0.5 to 5000nM). The cells were harvested and the lysates were prepared from each condition. Total heme from lead-treated cells (A) or mercury-treated cells (C) were measured by HPLC as described in Materials and Methods. RH was measured using the lysates by the RH assay in lead (B) or mercury (D) treated cells. *P< 0.01, **P<0.001, ***p<0.0001, One-way ANOVA using Dunnett’s multiple comparisons. Data are mean±sem of at least six independent experiments.
Figure 6
Figure 6. The effect of Amylod-β (Aβ) peptide on regulatory and total heme
IMR90 cell cultures were incubated with 500 nM Aβ40. At different time points (0.5 to 24 hr) the cells were then harvested, lysates prepared, and RH and total heme were measured by the RH assay and HPLC, respectively. (A) Nonlinear regression analysis of the time-dependent effect of Aβ on RH (one-phase exponential decay) (Prism 6.0 software, GraphPad, San Diego, CA, USA). *p<0.01, **p<0.001, One-way ANOVA using Dunn’s multiple comparisons. The data are the mean ± sem of four independent experiments. (B) The time-dependent effect of Aβ on total heme. No statistical significance was observed. Data was plotted using linear regression (R2=0.02). The data are the mean ± sem of at least three independent experiments.

References

    1. Smith LJ, Kahraman A, Thornton JM. Heme proteins--diversity in structural characteristics, function, and folding. Proteins. 2010;78:2349–68. doi: 10.1002/prot.22747. - DOI - PubMed
    1. Paoli M, Marles-Wright J, Smith A. Structure-function relationships in heme-proteins. DNA Cell Biol. 2002;21:271–80. - PubMed
    1. Ajioka RS, Phillips JD, Kushner JP. Biosynthesis of heme in mammals. Biochim Biophys Acta. 2006;1763:723–36. - PubMed
    1. Morgan WT, Liem HH, Sutor RP, Muller-Ebergard U. Transfer of heme from heme-albumin to hemopexin. Biochim Biophys Acta. 1976;444:435–45. - PubMed
    1. Girvan HM, Munro AW. Heme sensor proteins. J Biol Chem. 2013;288:13194–203. doi: 10.1074/jbc.R112.422642. - DOI - PMC - PubMed
    2. Liebl U, Lambry JC, Vos MH. Primary processes in heme-based sensor proteins. Biochim Biophys Acta. 2013;1834:1684–92. doi: 10.1016/j.bbapap.2013.02.025. - DOI - PubMed

Publication types