. 2014 Dec 18;41(6):1001-12.
doi: 10.1016/j.immuni.2014.12.011. Epub 2014 Dec 8.

Dysfunctional HIV-specific CD8+ T cell proliferation is associated with increased caspase-8 activity and mediated by necroptosis

Affiliations

Dysfunctional HIV-specific CD8+ T cell proliferation is associated with increased caspase-8 activity and mediated by necroptosis

Gaurav D Gaiha et al. Immunity. .

Abstract

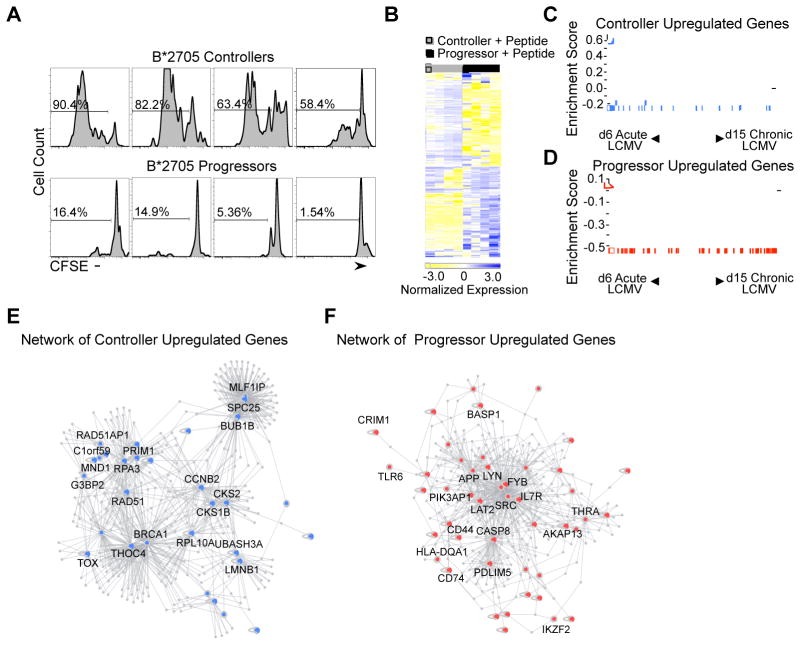
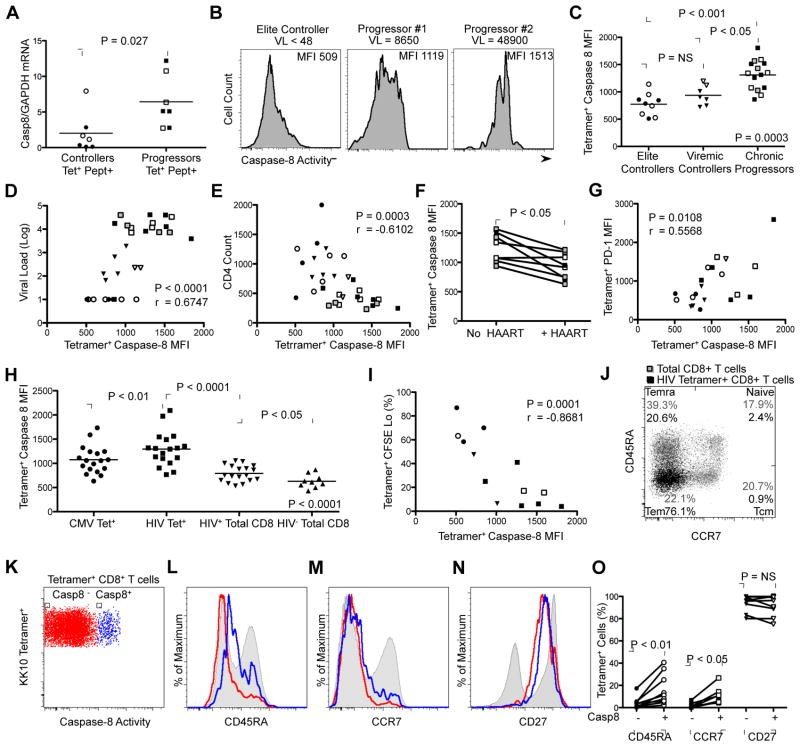
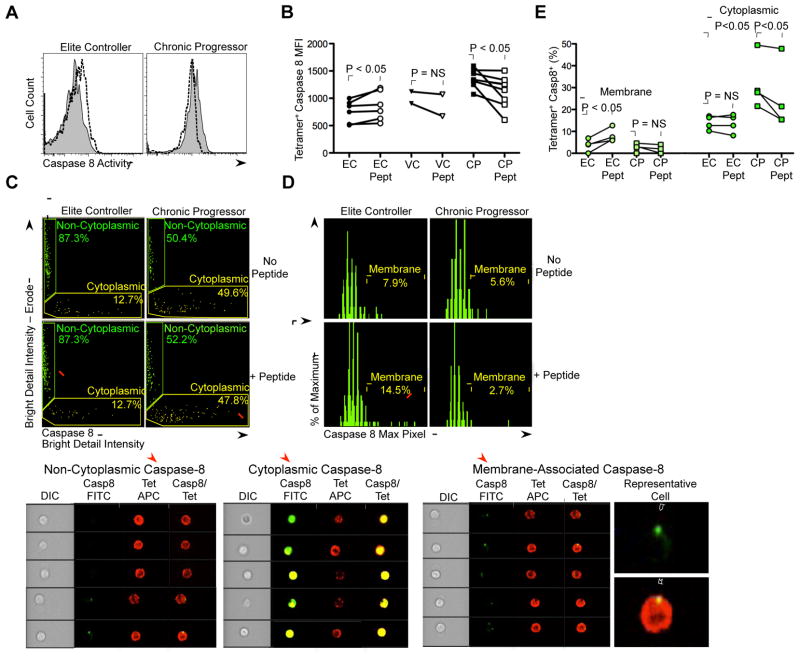
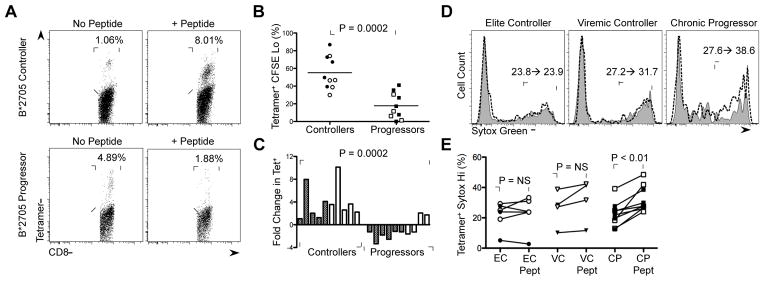
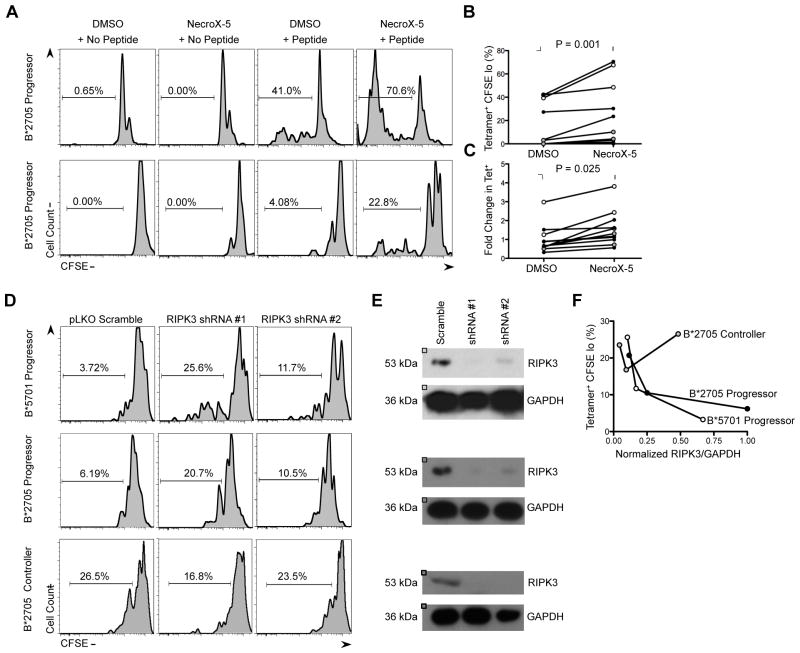
Decreased HIV-specific CD8(+) T cell proliferation is a hallmark of chronic infection, but the mechanisms of decline are unclear. We analyzed gene expression profiles from antigen-stimulated HIV-specific CD8(+) T cells from patients with controlled and uncontrolled infection and identified caspase-8 as a correlate of dysfunctional CD8(+) T cell proliferation. Caspase-8 activity was upregulated in HIV-specific CD8(+) T cells from progressors and correlated positively with disease progression and programmed cell death-1 (PD-1) expression, but negatively with proliferation. In addition, progressor cells displayed a decreased ability to upregulate membrane-associated caspase-8 activity and increased necrotic cell death following antigenic stimulation, implicating the programmed cell death pathway necroptosis. In vitro necroptosis blockade rescued HIV-specific CD8(+) T cell proliferation in progressors, as did silencing of necroptosis mediator RIPK3. Thus, chronic stimulation leading to upregulated caspase-8 activity contributes to dysfunctional HIV-specific CD8(+) T cell proliferation through activation of necroptosis and increased cell death.


Figures

Figure 1
Figure 1. Transcriptional profiling analysis of peptide-stimulated HIV-specific CD8+ T cells from ECs and CPs
(A) Histograms of gated viable CD8+ KK10-specific tetramer+ lymphocytes in B*2705 controllers and CPs stimulated with KK10 peptide (10 ng/mL). Numbers over bracketed lines indicate the percentages of the gated population (KK10 Tetramer+ CD8+ T cells) that have undergone at least one cell division after 6 days in culture. (B) The top differentially expressed genes in peptide-stimulated controller and CP KK10-specific CD8+ T cells are shown. Each column represents an individual sample and each row an individual gene, colored to indicate normalized expression (blue = increased expression, yellow = decreased expression). (C, D) Gene set enrichment analysis of upregulated gene sets in ECs and CPs with Day 6 LCMV Arm-specific CD8+ T cells (Acute LCMV) and Day 15 LCMV Cl13-specific CD8+ T cells (Chronic LCMV). The upregulated genes in HIV-specific CD8+ T cells from ECs were strongly enriched in the Acute LCMV Armstrong gene set (FDR q-value < 0.25). The upregulated genes in HIV-specific CD8+ T cells from CPs were strongly enriched in the Chronic LCMV Clone 13 gene set (FDR q-value < 0.25). The vertical blue and red bars indicate the individual genes that are enriched in both gene sets. (E, F) Direct and indirect DAPPLE networks built from upregulated gene expression sets from peptide-stimulated ECs (blue) and CPs (red) using known high-confidence pairwise protein-protein interactions (Rossin et al., 2011; Lage et al., 2008). See also Supplemental Table 2 and 3.
Figure 2
Figure 2. Caspase-8 activity is upregulated in HIV-specific CD8+ T cells and is associated with disease progression
(A) Real-time qPCR measurement of caspase-8 expression relative to GAPDH expression from sorted peptide-stimulated HIV-specific Tetramer+ CD8+ T cells from ECs (n = 7) and CPs (n = 7). Filled symbols represent HLA-B*2705 KK10 tetramer+ responses and open symbols represent HLA-B*5701 KF11 tetramer+ responses. Relative expression was calculated using the 2−ΔΔ Ct method (Livak et al., 2001). Statistical analysis was made using the Mann-Whitney test. (B) Representative caspase-8 mean fluorescence intensity (MFI) values of KK10-specific CD8+ T cells in three HLA-B*2705 HIV+ patients with diverse viral loads. (C) Relative mean fluorescence intensity (MFI) of caspase-8 activity on HIV-specific CD8+ T cells from ECs (n = 9), VC (n = 7) and CPs (n = 15). Filled symbols represent HLA-B*2705 KK10-specific response, open symbols represent HLA-B*5701 KF11-specific responses and gray symbols represent non-HLA B*2705/non-HLA B*5701 responses. Horizontal bars indicate mean MFI of caspase-8 activity. Kruskal-Wallis test was used for comparison among all groups of subjects; the Dunns post-test was used for comparisons between groups. (D) Positive correlation between MFI of caspase-8 activity of HIV-specific CD8+ T cells and viral load (n = 31). (E) Negative correlation between MFI of caspase-8 activity of HIV-specific CD8+ T cells and CD4+ T cell count (n = 31). (F) Caspase-8 activity decreases in HIV-specific CD8+ T cells following initiation of HAART (n = 9). Statistical comparisons were made using the Wilcoxon matched pairs test. (G) Positive correlation between MFI of caspase-8 activity and MFI of PD-1 expression on HIV-specific CD8+ T cells (n = 21). (H) Mean fluorescence intensity of caspase-8 activity of A*0201 SL9-specific CD8+ T cells compared with A*0201 CMV pp65 NV9-specific CD8+ T cells and total CD8+ T cells in patients naïve from anti-retroviral therapy (n = 18), and total CD8+ T cells from A*0201 HIV-seronegative controls (n = 9). Repeated measures analysis of variance was used for comparison CMV Tet+, HIV Tet+ and HIV Total CD8+ given that these were paired observations. Mann-Whitney test was used for comparison of HIV+ and HIV Total CD8+. (I) Negative correlation between MFI of caspase-8 activity of HIV-specific CD8+ T cells and percentage of CFSE lo Tetramer+ cells following peptide stimulation (n = 13). Correlation statistics for D, E, G and I were calculated using the Spearman correlation. (J) Representative CCR7 and CD45RA staining of total CD8+ T cells (gray) and HIV tetramer+ CD8+ T cells (black) from an HIV+ CP to identify naïve, central memory (Tcm), effector memory (Tem) and terminal effector (Temra) cells. (K) Representative FACS plot of KK10 tetramer+ CD8+ T cells identifying caspase-8 negative (Casp8-; red) and positive (Casp8+; blue) cells. (L, M, N) Representative histograms of CD45RA, CCR7 and CD27 staining of KK10 tetramer+ Casp8 CD8+ T cells (red), KK10 tetramer+ Casp8+ CD8+ T cells (blue) and total CD8+ T cells (gray). (O) Summary of phenotypic data for HIV tetramer+ Casp8 and Casp8+ CD8+ T cells analyzed for CD45RA, CCR7 and CD27 (n = 10). Horizontal bars indicate mean percentage of HIV tetramer+ Casp8 and Casp8+ CD8+ T cells that were positive for the indicated marker. Statistical comparisons were made by the Wilcoxon matched pairs test.
Figure 3
Figure 3. Effect of peptide stimulation on caspase-8 activity and localization in HIV-specific CD8+ T cells
(A) Representative data showing modulation in MFI of caspase-8 activity following 1h peptide stimulation (1 ug/mL) in KK10-specific CD8+ T cell responses from an HLA-B*2705 EC and CP. Filled plot (gray) represents caspase-8 MFI in the absence of KK10 peptide and dashed line represents caspase-8 MFI in the presence of KK10 peptide. (B) Summary data of change in caspase-8 activity following peptide stimulation in ECs (n = 6), VC (n = 2) and CPs (n = 8). Filled symbols represent HLA-B*2705 KK10-specific responses and open symbols represent HLA-B*5701 KF11-specific responses. Statistical comparisons were made using the Wilcoxon matched pairs test. (C) Representative plots of Imagestream analysis of KK10 Tetramer+ CD8+ T cells from an HLA-B*2705 EC and CP in the presence and absence of KK10 peptide (1 μg/mL). The Imagestream plots depict total cellular caspase-8 activity on the x-axis (Caspase-8 Bright Detail Intensity; Cytoplasmic, yellow) and caspase-8 activity localized in a circular ring located around the edge of the cell on the y-axis (Caspase-8 Bright Detail Intensity – Erode; Non-cytoplasmic, green). Representative images corresponding to non-cytoplasmic and cytoplasmic caspase-8 cells are shown in the lower panels. (D) Representative histograms of Imagestream analysis of non-cytoplasmic caspase-8 KK10 Tetramer+ CD8+ T cells. The histograms depict the maximum pixels of caspase-8 activity on the x-axis, which successfully differentiates caspase-8+ KK10 Tetramer+ CD8+ T cells with membrane-associated caspase-8 activity from those with negative caspase-8 activity. Representative images of membrane-associated caspase-8 positive cells are shown in the lower panels. (E) Summary of percentage of membrane-associated caspase-8 and cytosolic caspase-8 positive KK10-specific CD8+ T cells within a group of ECs (n = 4) and CPs (n = 4). Statistical analyses were carried out using the paired t test (intra-patient group comparison, −/+ peptide) and the Mann-Whitney test (inter-patient group comparison). See also Supplemental Figure 3.
Figure 4
Figure 4. Effect of peptide stimulation on HIV-specific CD8+ T cell expansion and induction of cellular necrosis
(A) Representative data of change in percentage of KK10-specific CD8+ T cells upon peptide stimulation in a HLA-B*2705 EC and CP. (B) Percentage of CFSE lo Tetramer+ CD8+ T cells in HLA-B*2705 KK10-specific (filled) and HLA-B*5701 KF11-specifc (open) CD8+ T cell responses in ECs and CPs. Statistical comparisons were made by the Mann-Whitney test. (C) Summary data of fold-change in Tetramer+ CD8+ T cells upon peptide stimulation in HLA-B*2705 KK10-specific (filled) and HLA-B*5701 KF11-specific (open) CD8+ T cell responses in ECs and CPs presented in (B). Statistical comparisons were made by the Mann-Whitney test. (D) Representative data of change in percentage of Sytox green Hi KK10-specific CD8+ T cells upon peptide stimulation in an HLA-B*2705 EC, viremic controller and CP. Filled plot (gray) represents Sytox green staining in the absence of KK10 peptide and dashed line represents Sytox green staining in the presence of KK10 peptide. (E) Summary data of change in percentage of Sytox green Hi HIV-specific CD8+ T cells following peptide stimulation in ECs (n = 6), VC (n = 4) and CPs (n = 8). Statistical comparisons were made using the Wilcoxon matched pairs test. See also Supplemental Figure 4.
Figure 5
Figure 5. Blockade of necroptosis restores HIV-specific CD8+ T cell proliferation
(A) Representative data of increased proliferation of CFSE-loaded KK10 tetramer+ CD8+ T cells from two HLA-B*2705 CPs in the presence of NecroX-5 (1uM). (B) Summary data of change in proliferation of HIV tetramer+ CD8+ T cells in the presence of NecroX-5 in CPs (n = 12). Filled symbols represent HLA-B*2705 KK10 tetramer+ esponses and open symbols represent HLA-B*5701 KF11 tetramer+ responses. Statistical analyses were made using the Wilcoxon matched pairs test. (C) Summary data of expansion of HIV tetramer+ CD8 T cells in the presence of NecroX-5 in CPs (n = 12). Statistical analyses were made using the Wilcoxon matched pairs test. (D) Representative data of increased proliferation of CFSE-loaded KK10 tettramer+ CD8+ T cells from an HLA-B*5701 CP, an HLA-B*2705 CP and an HLA-B*2705 EC were transduced with lentiviral vectors encoding control shRNA (pLKO Scramble) or two sequence-independent shRNA constructs specific for necroptosis activating gene RIPK3 (RIPK3 shRNA #1 and #2). (E) Primary CD8+ T cells from the three patients in (D) were assessed for RIPK3 protein expression by western blotting following lentiviral transduction and 7d puromycin selection. GAPDH was used as a loading control. (F) Correlation between level of RIPK3 silencing with percentage of HIV tetramer+ CFSE lo CD8+ T cells in patients presented in (D). Expression of RIPK3 was normalized to GAPDH control.

References

    1. Alam A, Cohen LY, Aouad S, Sekaly RP. Early activation of caspases during T lymphocyte stimulation results in selective substrate cleavage in nonapoptotic cells. The Journal of experimental medicine. 1999;190:1879–1890. - PMC - PubMed
    1. Arends JE, Hoepelman AI, Nanlohy NM, Hoppener FJ, Hirsch KR, Park JG, van Baarle D. Low doses of the novel caspase-inhibitor GS-9450 leads to lower caspase-3 and -8 expression on peripheral CD4+ and CD8+ T-cells. Apoptosis : an international journal on programmed cell death. 2011;16:959–966. - PMC - PubMed
    1. Betts MR, Nason MC, West SM, De Rosa SC, Migueles SA, Abraham J, Lederman MM, Benito JM, Goepfert PA, Connors M, et al. HIV nonprogressors preferentially maintain highly functional HIV-specific CD8+ T cells. Blood. 2006;107:4781–4789. - PMC - PubMed
    1. Boatright KM, Deis C, Denault JB, Sutherlin DP, Salvesen GS. Activation of caspases-8 and -10 by FLIP(L) The Biochemical journal. 2004;382:651–657. - PMC - PubMed
    1. Ch’en IL, Tsau JS, Molkentin JD, Komatsu M, Hedrick SM. Mechanisms of necroptosis in T cells. The Journal of experimental medicine. 2011;208:633–641. - PMC - PubMed

Publication types

MeSH terms

Associated data