. 2014 Dec;93(28):e255.
doi: 10.1097/MD.0000000000000255.

The role of cytochromes p450 and aldo-keto reductases in prognosis of breast carcinoma patients

Affiliations

The role of cytochromes p450 and aldo-keto reductases in prognosis of breast carcinoma patients

Viktor Hlaváč et al. Medicine (Baltimore). 2014 Dec.

Abstract

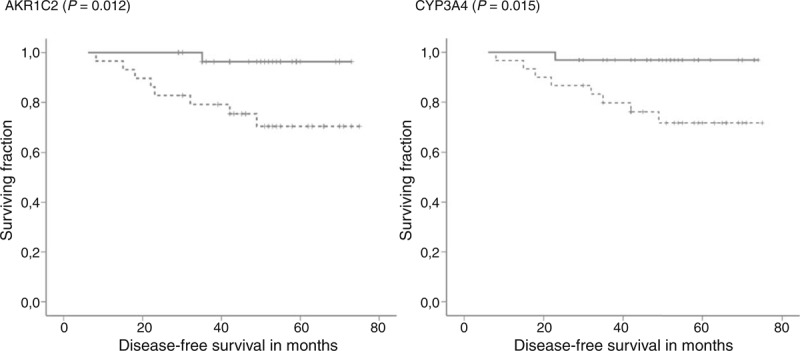
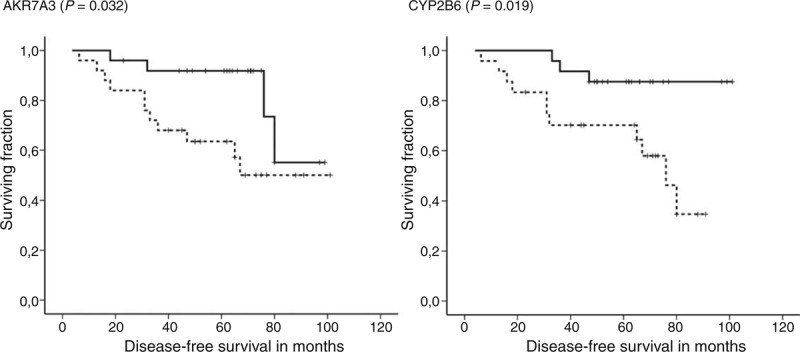
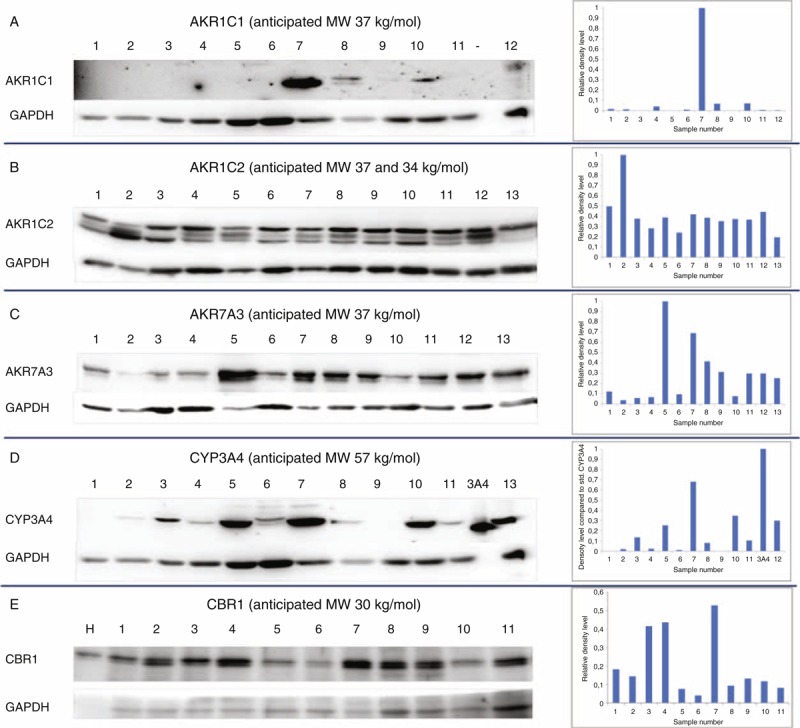
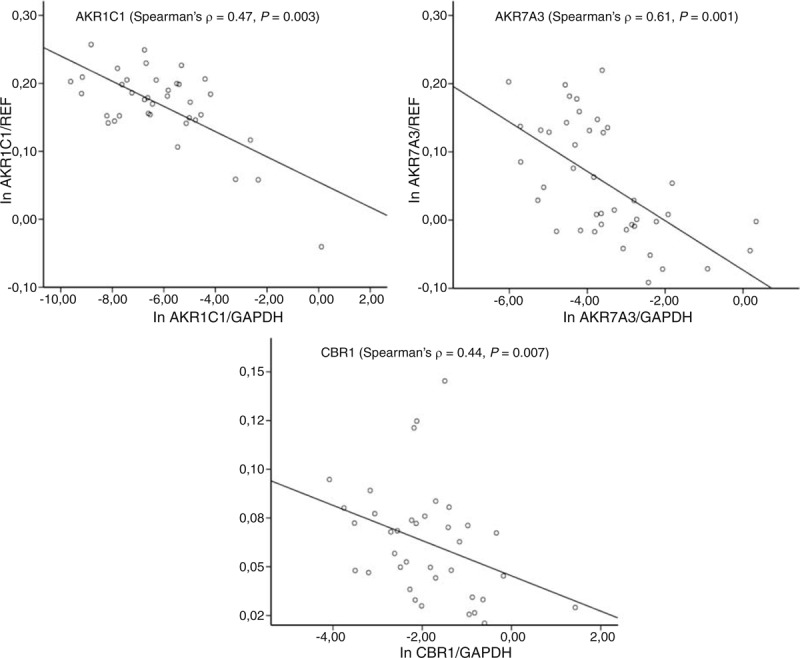
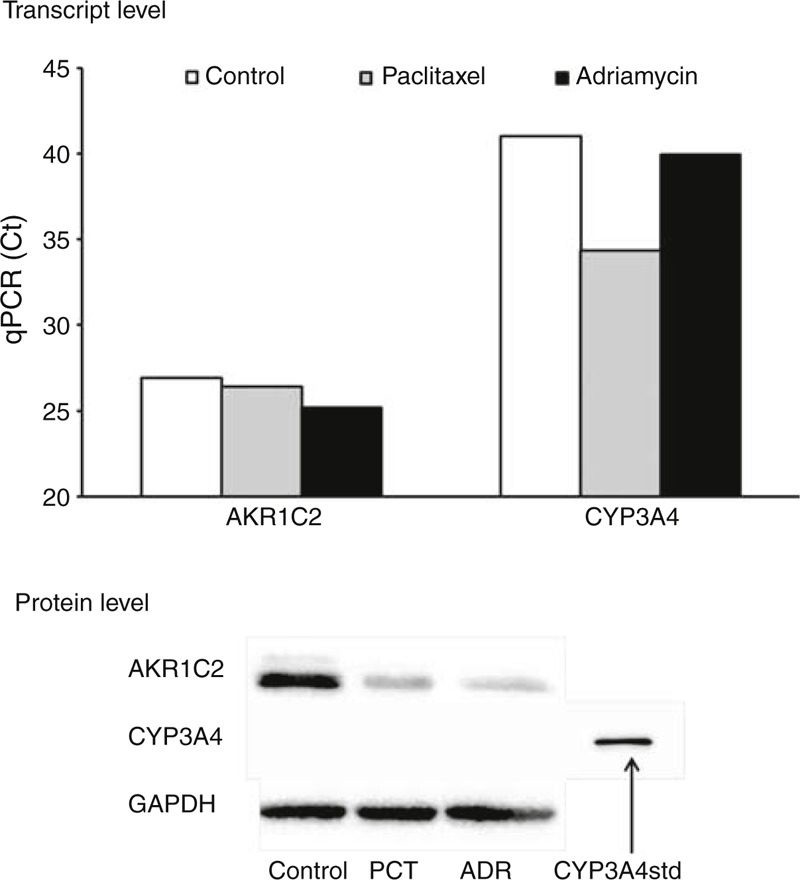
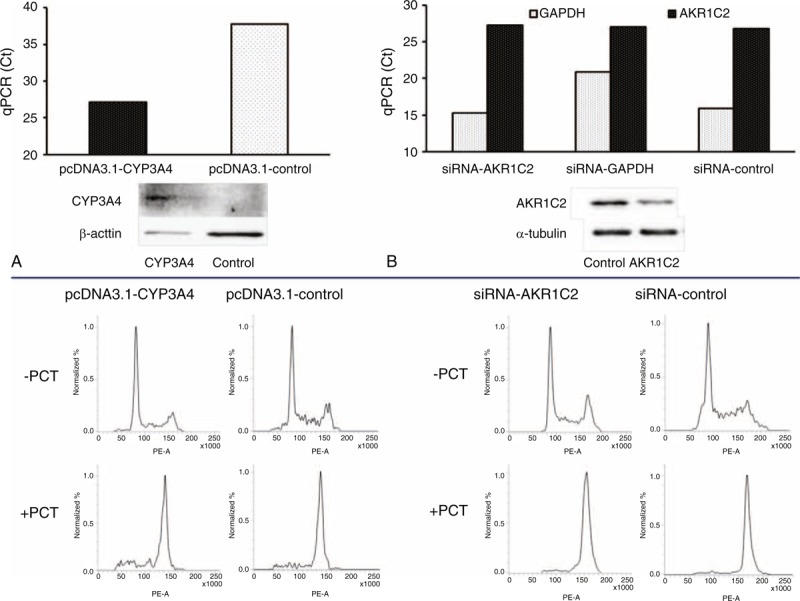
Metabolism of anticancer drugs affects their antitumor effects. This study has investigated the associations of gene expression of enzymes metabolizing anticancer drugs with therapy response and survival of breast carcinoma patients. Gene expression of 13 aldo-keto reductases (AKRs), carbonyl reductase 1, and 10 cytochromes P450 (CYPs) was assessed using quantitative real-time polymerase chain reaction in tumors and paired adjacent nonneoplastic tissues from 68 posttreatment breast carcinoma patients. Eleven candidate genes were then evaluated in an independent series of 50 pretreatment patients. Protein expression of the most significant genes was confirmed by immunoblotting. AKR1A1 was significantly overexpressed and AKR1C1-4, KCNAB1, CYP2C19, CYP3A4, and CYP3A5 downregulated in tumors compared with control nonneoplastic tissues after correction for multiple testing. Significant association of CYP2B6 transcript levels in tumors with expression of hormonal receptors was found in the posttreatment set and replicated in the pretreatment set of patients. Significantly higher intratumoral levels of AKR1C1, AKR1C2, or CYP2W1 were found in responders to neoadjuvant chemotherapy compared with nonresponders. Patients with high AKR7A3 or CYP2B6 levels in the pretreatment set had significantly longer disease-free survival than patients with low levels. Protein products of AKR1C1, AKR1C2, AKR7A3, CYP3A4, and carbonyl reductase (CBR1) were found in tumors and those of AKR1C1, AKR7A3, and CBR1 correlated with their transcript levels. Small interfering RNA-directed knockdown of AKR1C2 or vector-mediated upregulation of CYP3A4 in MDA-MB-231 model cell line had no effect on cell proliferation after paclitaxel treatment in vitro. Prognostic and predictive roles of drug-metabolizing enzymes strikingly differ between posttreatment and pretreatment breast carcinoma patients. Mechanisms of action of AKR1C2, AKR7A3, CYP2B6, CYP3A4, and CBR1 should continue to be further followed in breast carcinoma patients and models.


Conflict of interest statement

The authors have no conflicts of interest to disclose.

Figures

FIGURE 1
FIGURE 1
Associations between gene expression levels and DFS of posttreatment patients. Kaplan–Meier survival curves were plotted for patients (n = 65) divided into 2 groups according to the median of transcript levels in tumors. Dashed lines represent the group with lower transcript levels and solid lines represent the group with higher levels than median. Differences between groups were compared using log-rank test. Gene names and significant differences between groups are displayed. All clinical data have been analyzed, but to retain concise style only significant changes are reported. DFS = disease-free survival.
FIGURE 2
FIGURE 2
Associations between gene expression levels and DFS of pretreatment patients. Kaplan–Meier survival curves were plotted for patients (n = 50) divided into 2 groups according to the median of transcript levels in tumors. Dashed lines represent the group with lower transcript levels and solid lines represent the group with higher levels than median. Differences between groups were compared using log-rank test. Gene names and significant differences between groups are displayed. All clinical data have been analyzed, but to retain concise style only significant changes are reported. DFS = disease-free survival.
FIGURE 3
FIGURE 3
Protein expression of selected candidates in tumors of breast carcinoma patients. Protein expression of (A) AKR1C1, (B) AKR1C2, (C) AKR7A3, (D) CYP3A4, and (E) CBR1 was assessed by immunoblotting (left part) and evaluated by densitometry with normalization to GAPDH (right part) in representative set of breast tumors as described in the “Methods.” Anticipated molecular weight (MW) in kg/mol (in the ±20% range) is presented for each protein according to Human Protein Atlas (http://www.proteinatlas.org). GAPDH = glyceraldehyde phosphate dehydrogenase.
FIGURE 4
FIGURE 4
Correlation between protein and transcript levels. Protein levels were analyzed by densitometry with normalization to GAPDH (X-axis) and compared with transcript levels normalized to reference genes (Y-axis). Normalized protein and transcript levels were logarithmically normalized before comparison. GAPDH = glyceraldehyde phosphate dehydrogenase.
FIGURE 5
FIGURE 5
Interaction between PCT or doxorubicin and protein and transcript levels of CYP3A4 and AKR1C2 in vitro. MDA-MB-231 cell line was incubated without (control) or with 100 nM PCT or 30 μM adriamycin (ADR) as described in the “Methods.” qPCR and immunoblotting were done 48 h after the incubation. Ct values from qPCR are presented in the upper part. The higher is the Ct value the lower is the transcript expression. Immunoblots with 10 μg of protein per lane for AKR1C2 and 20 μg of protein or 0.25 pmol of standard for CYP3A4 per lane are presented in the lower part. Two independent experiments were performed with consistent results. Ct = cycle threshold, PCT = paclitaxel, qPCR = quantitative real-time polymerase chain reaction.
FIGURE 6
FIGURE 6
Influence of AKR1C2 silencing and CYP3A4 induction on MDA-MB-231 cell line proliferation after exposure to PCT in vitro. CYP3A4 expression was induced by transfection MDA-MB-231 cell line with the pcDNA3.1-CYP3A4 plasmid (A) and expression of AKR1C2 was decreased by the siRNA against AKR1C2 (B) as described in the “Methods.” Efficiency of cell manipulations was monitored by qPCR and immunoblotting (30 μg of protein per lane for CYP3A4 and 10 μg of protein per lane for AKR1C2). Transcript and protein levels of influenced cells with the respective controls are presented in the upper part. Cells were incubated without (PCT−) or with 100 nM PCT+ for 24 h and then cell proliferation was analyzed using flow cytometry (lower part). Two independent experiments were performed with consistent results. PCT = paclitaxel, siRNA = small interfering RNA.

References

    1. Ferlay J, Shin HR, Bray F, et al. GLOBOCAN 2008, Cancer Incidence and Mortality Worldwide: IARC CancerBase No. 10. Lyon, France: International Agency for Research on Cancer; 2010.
    1. Baguley BC. Multiple drug resistance mechanisms in cancer. Mol Biotechnol 2010; 46:308–316. - PubMed
    1. Johansson I, Ingelman-Sundberg M. Genetic polymorphism and toxicology with emphasis on cytochrome P450. Toxicol Sci 2011; 120:1–13. - PubMed
    1. Roy P, Yu LJ, Crespi CL, et al. Development of a substrate-activity based approach to identify the major human liver P-450 catalysts of cyclophosphamide and ifosfamide activation based on cDNA-expressed activities and liver microsomal P-450 profiles. Drug Metab Dispos 1999; 27:655–666. - PubMed
    1. Chang TK, Weber GF, Crespi CL, et al. Differential activation of cyclophosphamide and ifosphamide by cytochromes P-450 2B and 3A in human liver microsomes. Cancer Res 1993; 53:5629–5637. - PubMed

Publication types

MeSH terms