. 2014 Dec 20;16(1):102.
doi: 10.1186/s12968-014-0102-0.

Simultaneous three-dimensional myocardial T1 and T2 mapping in one breath hold with 3D-QALAS

Affiliations

Simultaneous three-dimensional myocardial T1 and T2 mapping in one breath hold with 3D-QALAS

Sofia Kvernby et al. J Cardiovasc Magn Reson. .

Abstract

Background: Quantification of the longitudinal- and transverse relaxation time in the myocardium has shown to provide important information in cardiac diagnostics. Methods for cardiac relaxation time mapping generally demand a long breath hold to measure either T1 or T2 in a single 2D slice. In this paper we present and evaluate a novel method for 3D interleaved T1 and T2 mapping of the whole left ventricular myocardium within a single breath hold of 15 heartbeats.

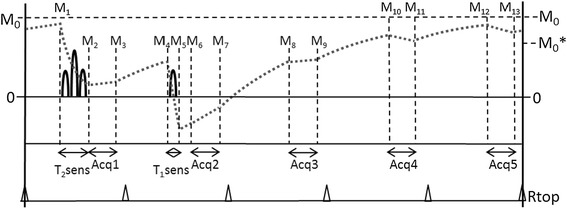
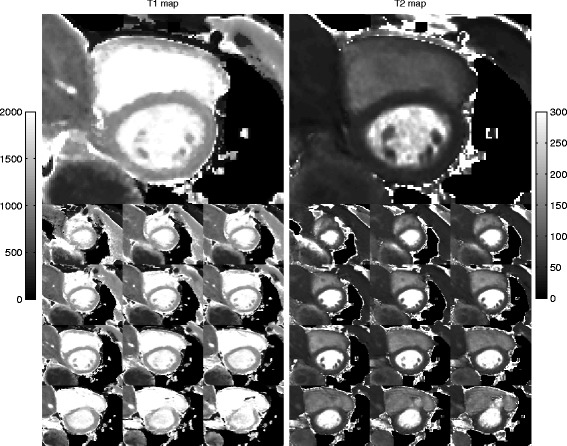
Methods: The 3D-QALAS (3D-quantification using an interleaved Look-Locker acquisition sequence with T2 preparation pulse) is based on a 3D spoiled Turbo Field Echo sequence using inversion recovery with interleaved T2 preparation. Quantification of both T1 and T2 in a volume of 13 slices with a resolution of 2.0x2.0x6.0 mm is obtained from five measurements by using simulations of the longitudinal magnetizations Mz. This acquisition scheme is repeated three times to sample k-space. The method was evaluated both in-vitro (validated against Inversion Recovery and Multi Echo) and in-vivo (validated against MOLLI and Dual Echo).

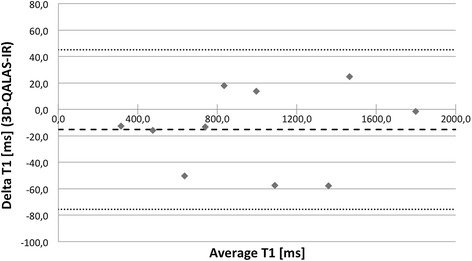
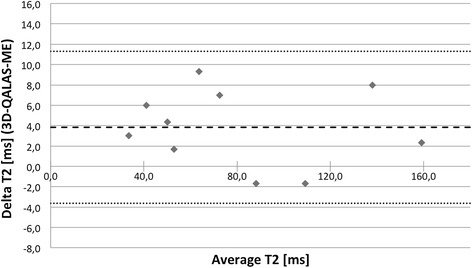
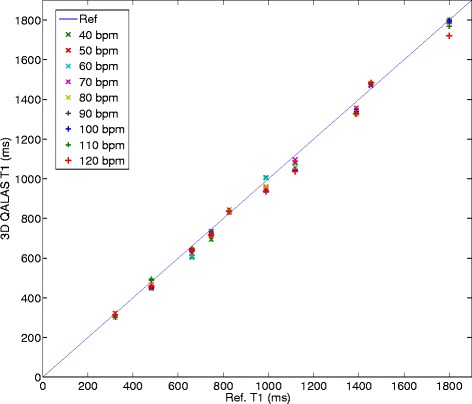
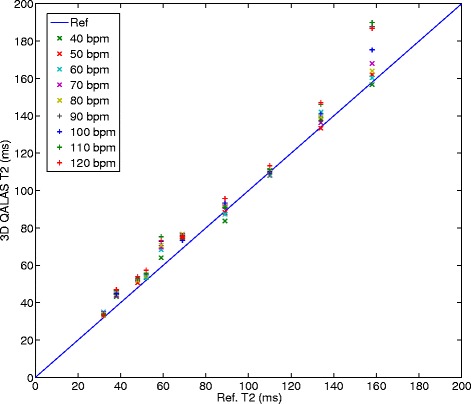
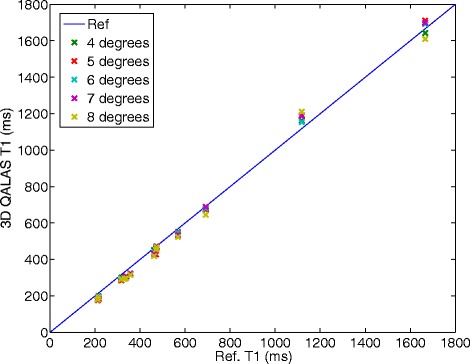
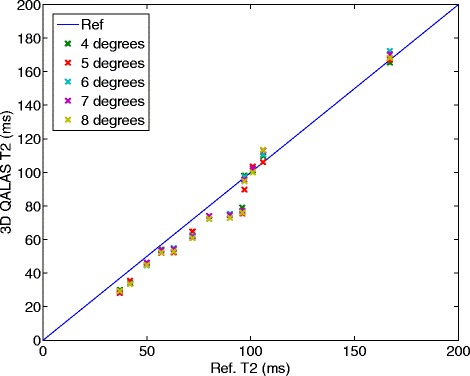
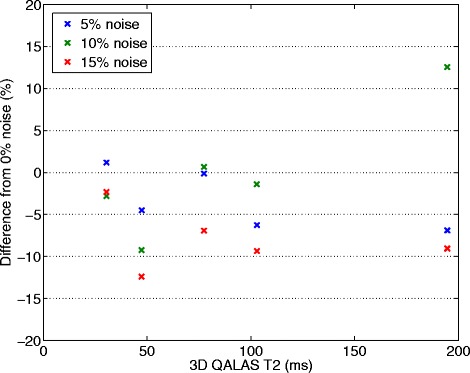
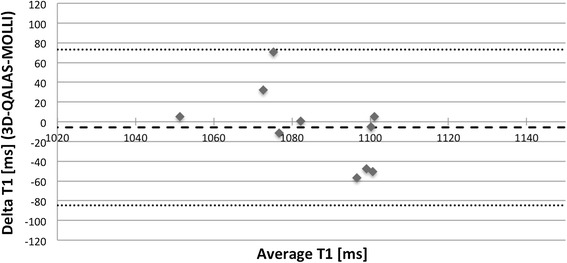
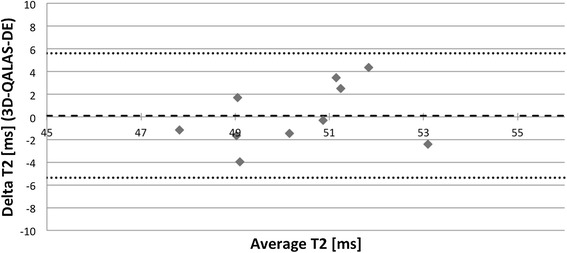
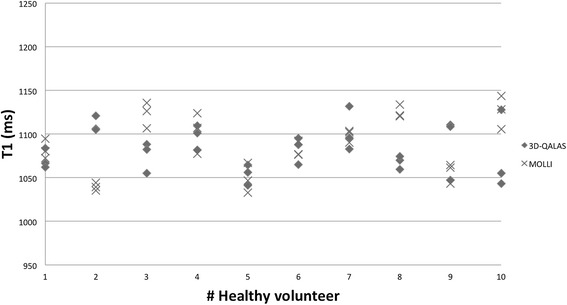
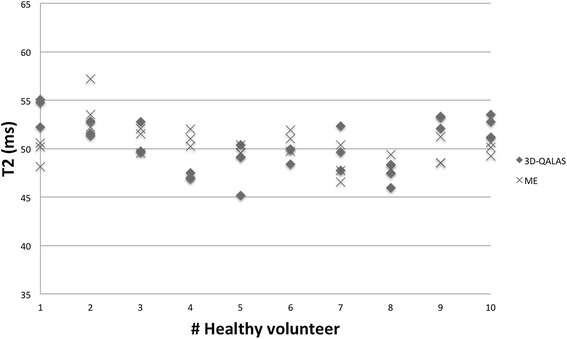
Results: In-vitro, a strong relation was found between 3D-QALAS and Inversion Recovery (R = 0.998; N = 10; p < 0.01) and between 3D-QALAS and Multi Echo (R = 0.996; N = 10; p < 0.01). The 3D-QALAS method showed no dependence on e.g. heart rate in the interval of 40-120 bpm. In healthy myocardium, the mean T1 value was 1083 ± 43 ms (mean ± SD) for 3D-QALAS and 1089 ± 54 ms for MOLLI, while the mean T2 value was 50.4 ± 3.6 ms 3D-QALAS and 50.3 ± 3.5 ms for Dual Echo. No significant difference in in-vivo relaxation times was found between 3D-QALAS and MOLLI (N = 10; p = 0.65) respectively 3D-QALAS and Dual Echo (N = 10; p = 0.925) for the ten healthy volunteers.

Conclusions: The 3D-QALAS method has demonstrated good accuracy and intra-scan variability both in-vitro and in-vivo. It allows rapid acquisition and provides quantitative information of both T1 and T2 relaxation times in the same scan with full coverage of the left ventricle, enabling clinical application in a broader spectrum of cardiac disorders.


Figures

Figure 1
Figure 1
Schematic overview of the proposed acquisition kernel. Five cardiac-triggered acquisitions (Acq1- Acq5) are performed during end-diastole. Prior to the first acquisition a T2-sensitizing phase decreases the Mz magnetization proportional to the T2 relaxation. Prior to the second acquisition a T1-sensitizing phase is applied to invert the Mz magnetization. No sensitizing phases are applied before the other acquisitions. The typical Mz magnetization evolution is displayed as the grey dotted line. At each interval the magnetization is labeled as M1-M13.
Figure 2
Figure 2
Bland-Altman plot for T1 values at 60 bpm with 3D-QALAS and inversion recovery in phantoms. Thick dashed line represents overall average difference between measurements (−15.3 ms), thin dashed lines represent 2SD.
Figure 3
Figure 3
Bland-Altman plot for T2 values at 60 bpm with 3D-QALAS and multi echo in phantoms. Thick dashed line represents overall average difference between measurements (3.8 ms), thin dashed lines represent 2SD.
Figure 4
Figure 4
Heart rate dependency in T1 measurement with 3D-QALAS. Relationship between longitudinal relaxation time measurements with 3D-QALAS and the corresponding reference values measured with Inversion Recovery for different heart rates (40–120 bpm).
Figure 5
Figure 5
Heart rate dependency in T2 measurements with 3D-QALAS. Relationship between transverse relaxation time measurements with 3D-QALAS and the corresponding reference values measured with Multi Echo for different heart rates (40–120 bpm).
Figure 6
Figure 6
Effect on T1 measurement using different radio frequency flip angles, α, during acquisition. Measured longitudinal relaxation time (T1) with 3D-QALAS for different radio frequency flip angles, α, during data acquisition and corresponding reference values measured with Inversion Recovery. Radio frequency flip angles are varied from 4 degrees to 8 degrees.
Figure 7
Figure 7
Effect on T2 measurement using different radio frequency flip angles, α, during acquisition. Measured transverse relaxation time (T2) with 3D-QALAS for different radio frequency flip angles, α, during data acquisition and corresponding reference values measured with Multi Echo. Radio frequency flip angles are varied from 4 degrees to 8 degrees.
Figure 8
Figure 8
Effect of deliberately applied arrhythmias on phantom T1 measurements. Gaussian noise distributions with three different widths (5%, 10% and 15%) were used to change the length of the cardiac cycle, initially 60 beats per minute (bpm), in order to simulate atrial fibrillation. Deviation in percentage from measurements with 60 bpm and 0% noise can be seen as a function of T1 values measured with 3D-QALAS at a heart rate of 60 bpm with 0% noise.
Figure 9
Figure 9
Effect of deliberately applied arrhythmias on phantom T2 measurements. Gaussian noise distributions with three different widths (5%, 10% and 15%) were used to change the length of the cardiac cycle, initially 60 beats per minute (bpm), in order to simulate atrial fibrillation. Deviation in percentage from measurements with 60 bpm and 0% noise can be seen as a function of T2 values measured with 3D-QALAS at a heart rate of 60 bpm with 0% noise.
Figure 10
Figure 10
3D-QALAS images from a healthy volunteer. The thirteen 3D-QALAS short axis slices T1 maps (left) and T2 maps (right) of the left ventricular myocardium are shown. Slice 8 is shown on a larger scale. The gray scale indicates 0–2000 ms for T1 and 0–300 ms for T2.
Figure 11
Figure 11
Bland-Altman plot for native myocardial T1 values with 3D-QALAS and MOLLI. Each healthy volunteer is represented with one measurement point. Thick dashed line represents overall average difference between measurements (−5,8 ms), thin dashed lines represent 2SD.
Figure 12
Figure 12
Bland-Altman plot for native myocardial T2 values with 3D-QALAS and Dual Echo. Each healthy volunteer is represented with one measurement point. Thick dashed line represents overall average difference between measurements (0,1 ms), thin dashed lines represent 2SD.
Figure 13
Figure 13
Individual myocardial T1 values from 3D-QALAS and MOLLI. Values are derived from four regions of interests (septal,anterior,lateral and posterior) in a mid-cavity short axis slice from three repeated measurements and are displayed as mean values representing each measurement.
Figure 14
Figure 14
Individual myocardial T2 values from 3D-QALAS and Two-Point Multi Echo (ME). Values are derived from four regions of interests (septal, anterior, lateral and posterior) in a mid-cavity short axis slice from three repeated measurements and are displayed as mean values representing each measurement.
Figure 15
Figure 15
Native and post contrast images from a 65 years old male with a lateral myocardial infarction. Pre and post contrast 3D-QALAS maps together with a conventional late gadolinium enhancement image illustrates the area of infarction.

References

    1. Chang KJ, Jara H. Applications of quantitative T1, T2, and proton density to diagnosis.Appl Radiol. 2005; 34–42.
    1. Riederer S, Lee J, Farzaneh F, Wang H, Wright R. Magnetic resonance image synthesis. clinical implementation. Acta Radiol Suppl. 1986;369:466. - PubMed
    1. Messroghli DR, Walters K, Plein S, Sparrow P, Friedrich MG, Ridgway JP, Sivananthan MU. Myocardial T1 mapping: application to patients with acute and chronic myocardial infarction. Magn Reson Med. 2007;58:34–40. doi: 10.1002/mrm.21272. - DOI - PubMed
    1. Iles L, Pfluger H, Phrommintikul A, Cherayath J, Aksit P, Gupta SN, Kaye DM, Taylor AJ. Evaluation of diffuse myocardial fibrosis in heart failure with cardiac magnetic resonance contrast-enhanced T1 mapping. J Am Coll Cardiol. 2008;52:1574–1580. doi: 10.1016/j.jacc.2008.06.049. - DOI - PubMed
    1. Sparrow P, Messroghli DR, Reid S, Ridgway JP, Bainbridge G, Sivananthan MU. Myocardial T1 mapping for detection of left ventricular myocardial fibrosis in chronic aortic regurgitation: pilot study. Am J Roentgenol. 2006;187(6):W630–W635. doi: 10.2214/AJR.05.1264. - DOI - PubMed

Publication types