

Tox: a multifunctional transcription factor and novel regulator of mammalian corticogenesis
- PMID: 25527292
- PMCID: PMC4388598
- DOI: 10.15252/embj.201490061
Tox: a multifunctional transcription factor and novel regulator of mammalian corticogenesis
Abstract
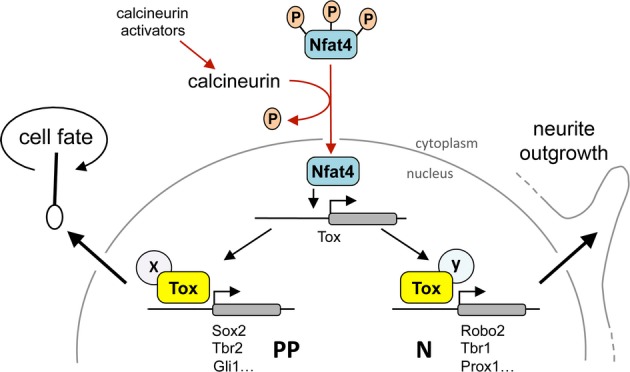
Major efforts are invested to characterize the factors controlling the proliferation of neural stem cells. During mammalian corticogenesis, our group has identified a small pool of genes that are transiently downregulated in the switch of neural stem cells to neurogenic division and reinduced in newborn neurons. Among these switch genes, we found Tox, a transcription factor with hitherto uncharacterized roles in the nervous system. Here, we investigated the role of Tox in corticogenesis by characterizing its expression at the tissue, cellular and temporal level. We found that Tox is regulated by calcineurin/Nfat signalling. Moreover, we combined DNA adenine methyltransferase identification (DamID) with deep sequencing to characterize the chromatin binding properties of Tox including its motif and downstream transcriptional targets including Sox2, Tbr2, Prox1 and other key factors. Finally, we manipulated Tox in the developing brain and validated its multiple roles in promoting neural stem cell proliferation and neurite outgrowth of newborn neurons. Our data provide a valuable resource to study the role of Tox in other tissues and highlight a novel key player in brain development.
Keywords: DamID sequencing; HMG‐box transcription factors; Tox; brain development; neural stem cells.
© 2014 The Authors.
Figures
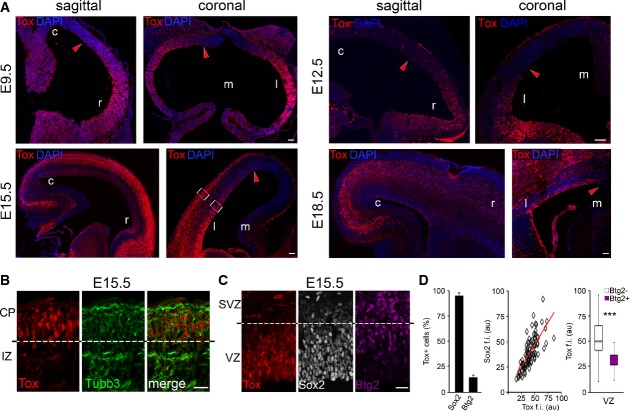
A-C Fluorescence pictures of WT (A and B) or Btg2RFP (C) mouse brains at E9.5, E12.5, E15.5 or E18.5 (as indicated) after immunohistochemistry for Tox (A-C; red), Tubb3 (B; green), Sox2 (C; white) or RFP (C; magenta) and DAPI counterstaining (A; blue).
D Quantification of Sox2+ or Btg2RFP+ cells within the Tox+ population (left; n = 3; error bars = SD) and immunoreactivity levels (au = arbitrary units) of each of the two makers relative to Tox represented as a linear correlation (middle; n = 79) or box plot (right; n ≥ 24), respectively. ***P < 0.001. Scale bars, 50 μm (A) or 40 μm (B).
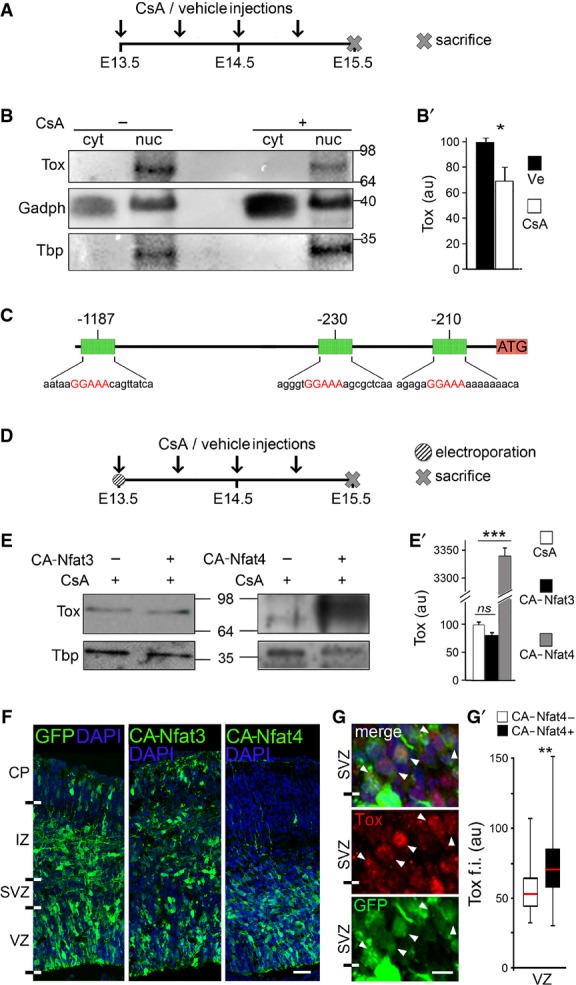
A-B′ Layout of CsA, or vehicle as control, administration during embryonic development (A) and Western blot analysis (B) of Tox levels in cytoplasmic (cyt) or nuclear (nuc) fractions of E15.5 brains. Quantifications (B′) were performed upon internal normalization for Gadph or Tbp and referred to treatment with vehicle. n = 3; error bars = SD; *P < 0.05.
C Map of Tox locus and Nfat-binding recognition sites (red) identified by MatInspector.
D-E′ Layout of CsA or vehicle administration and Western blot analysis as in (A–B′) upon in utero electroporation with CA-Nfat3 or CA-Nfat4 vectors at E13.5. Tox in extracts of E15.5 brains was quantified normalized to Tbp and referred to CsA treatment. n = 3; error bars = SD; ***P < 0.001.
F-G′ Fluorescent pictures of the mouse cortex upon electroporation with GFP, CA-Nfat3 or CA-Nfat4 (as indicated) followed by GFP (green) or Tox (G; red) immunolabelling and DAPI counterstaining (blue). Tox upregulation after CA-Nfat4 overexpression was assessed within nuclei of GFP+ cells (n = 30) in the VZ and represented as a box plot relative to GFP− cells (n = 30) used as internal control (G′). Tox ectopic expression within the SVZ is indicated (G; arrowheads). Scale bar, 50 μm (F) and 5 μm (G); **P < 0.01.
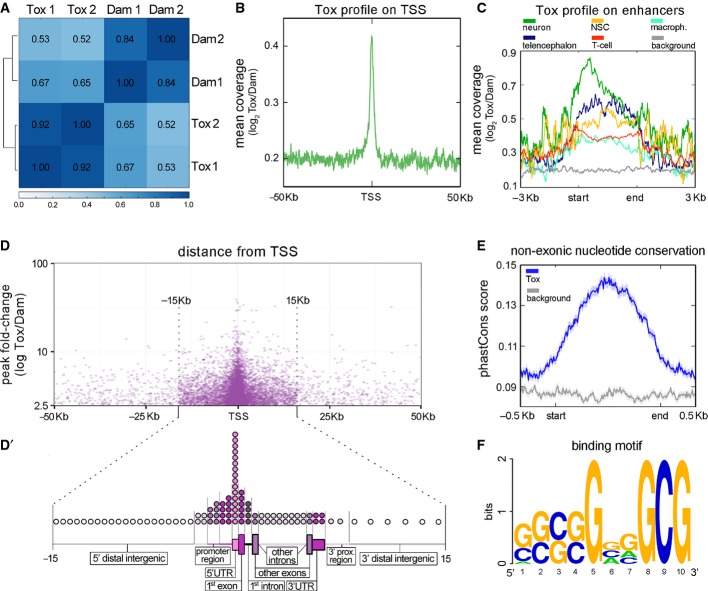
A Pearson's correlation analysis between Tox-Dam versus Dam reads of HEK-293T cells sampling the genome in windows of 10 kb.
B Meta-analysis of normalized Tox-Dam at the transcription start site (TSS) of Ensembl-annotated genes.
C Profile of normalized Tox-Dam reads on cell-specific enhancers (colours; categories ordered according to enrichment). Background (grey) was assessed based on the Tox signal at random genomic locations.
D Relationship between the fold-change of Tox peaks and their distance to the TSS. Note the enrichment in peaks at the boundary of ±15 kb from TSS and the correlation between their fold-change and proximity to the TSS.
D′ Distribution of Tox peaks within regions of loci (as indicated). The relative length of each genomic region was chosen to represent its average length across the human genome and circles distributed to represent the proportion of Tox peaks mapping on that given region (1 circle = 1%).
E PhastCons scores of 100 vertebrate genomes averaged for the Tox peak locations (blue) and for a matched genomic background (grey) showing higher conservation within Tox peaks (start-end).
F Putative 10-mer binding motif of Tox identified with gimmeMotifs.
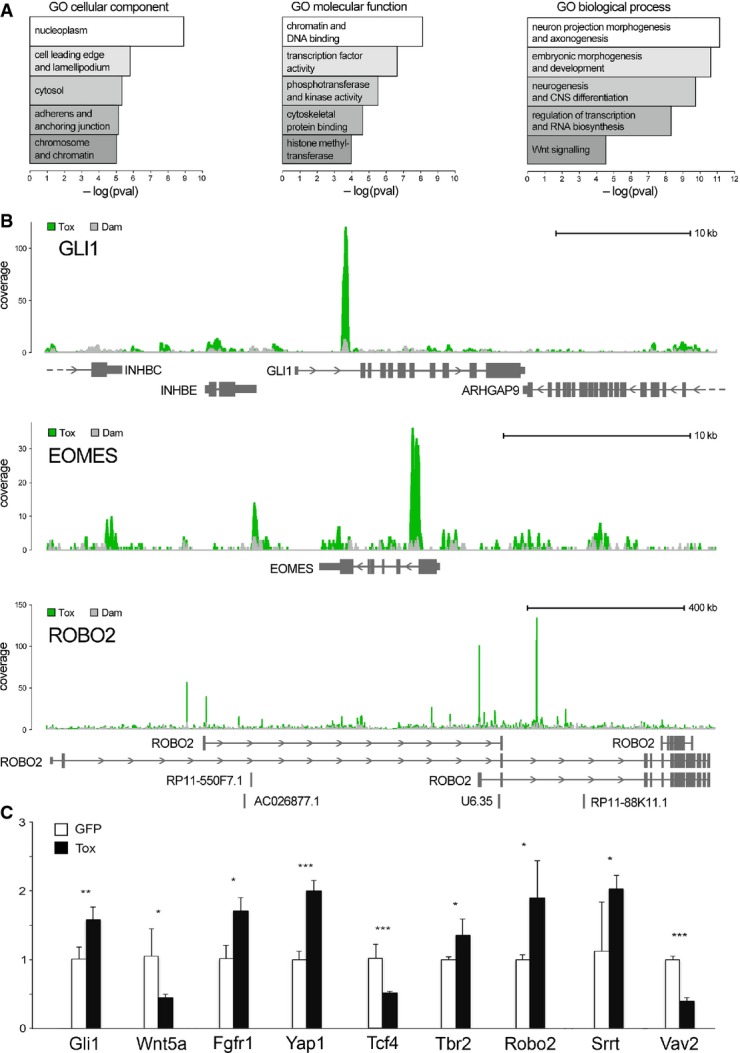
Functional enrichment scores for cellular compartment, molecular function and biological process (left to right).
Examples of Tox-Dam (green) or Dam (grey) peaks (superimposed in each panel) for Gli1, Eomes/Tbr2 and Robo2 (top to bottom) to represent factors involved in signalling, neurogenic commitment and neurite outgrowth, respectively.
qRT–PCRs of GFP+ FAC-sorted cells from the E15.5 mouse brain upon electroporation at E13.5 with control (white) or Tox (black) constructs. Primers (Supplementary Table S1) were selected to amplify multi-exon transcripts (indicated) to represent the classes of genes that would explain functional annotations in (A). n ≥ 3; error bars = SD; *P < 0.05; **P < 0.01; ***P < 0.001.
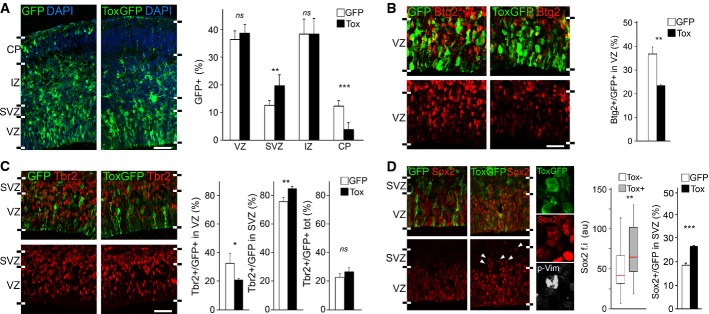
A-D Fluorescence pictures (left) and quantifications (right) of GFP+ (green) cells of the E15.5 lateral cortex positive for Btg2RFP (B), Tbr2 (C), Sox2 (D) (red) or p-Vim (D; white) upon electroporation with control or Tox (white or black bars, respectively) plasmids at E13.5. n ≥ 3; error bars = SD (except box plot in D, middle; n ≥ 50); ns = not significant; *P < 0.05; **P < 0.01; ***P < 0.001. Scale bars, 50 μm.
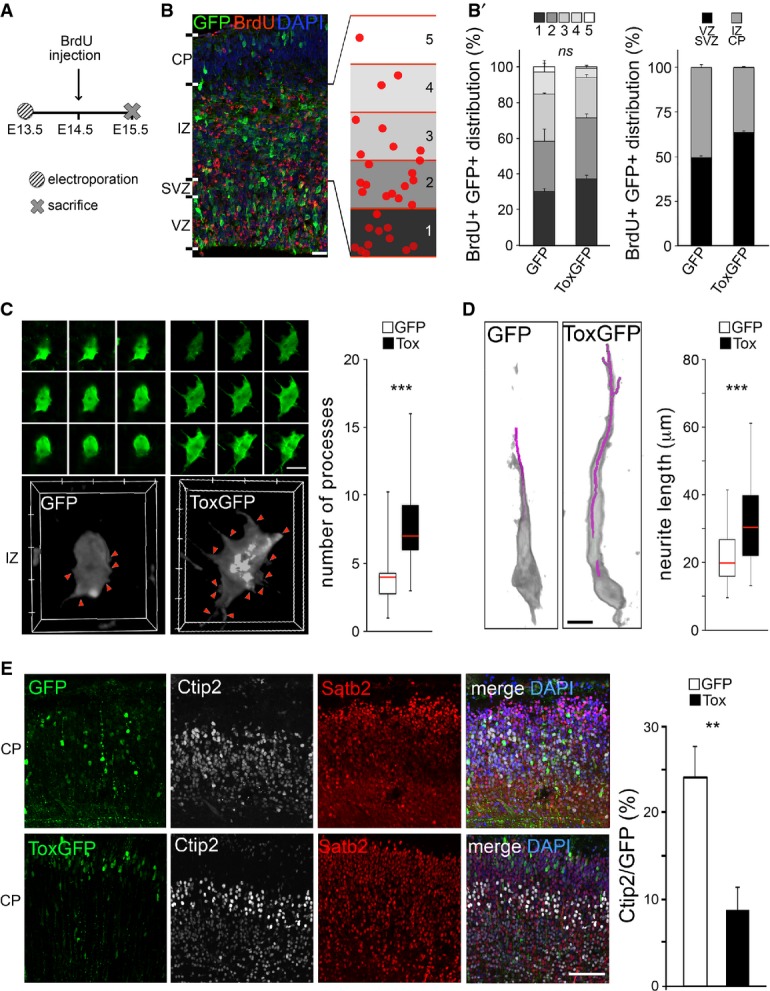
A-B′ Experimental layout (A), fluorescence pictures (B) and quantifications (B′) used to assess neuronal migration and output upon electroporation with GFP or Tox (B′; as indicated) plasmids at E13.5 followed by BrdU exposure and sacrifice as shown in (A). Neuronal migration was assessed by calculating the distribution of GFP+/BrdU+ cells within five equidistant bins of the IZ (B and B′; left), while output was quantified as the proportion of GFP+/BrdU+ in the IZ and CP relative to all GFP+ cells (B'; right). n = 2; error bars = SEM. Scale bar, 50 μm.
C, D 3D reconstruction (left) and quantification (right) of newborn (C) or polarized (D) neurons in the IZ or CP, respectively. Individual Z-stacks (0.1 μm optical thickness; green) and computer reconstructions (grey) were used to count cell protrusions (C; arrowheads) or neurite length (D; purple line) that were statistically evaluated (box plots; right, n ≥ 49; ***P < 0.001). Scale bars, 10 μm.
E Fluorescence pictures (left) of the E18.5 mouse cortex upon electroporation of GFP or Tox plasmids at E13.5 followed by immunohistochemistry for GFP (green), Ctip2 (white), Satb2 (red) and DAPI counterstaining (blue). Quantification of Ctip2+/GFP+ cells is shown in either condition (right). n = 3; **P < 0.01; error bars = SD. Scale bar, 50 μm.
Comment in
-
In-TOX-icating neurogenesis.EMBO J. 2015 Apr 1;34(7):832-4. doi: 10.15252/embj.201591107. Epub 2015 Feb 17. EMBO J. 2015. PMID: 25691243 Free PMC article.
References
-
- Andersson R, Gebhard C, Miguel-Escalada I, Hoof I, Bornholdt J, Boyd M, Chen Y, Zhao X, Schmidl C, Suzuki T, Ntini E, Arner E, Valen E, Li K, Schwarzfischer L, Glatz D, Raithel J, Lilje B, Rapin N, Bagger FO, et al. An atlas of active enhancers across human cell types and tissues. Nature. 2014;507:455–461. - PMC - PubMed
Publication types
MeSH terms
Substances
LinkOut - more resources
Full Text Sources
Other Literature Sources
Molecular Biology Databases
Research Materials
