RNA-processing proteins regulate Mec1/ATR activation by promoting generation of RPA-coated ssDNA
- PMID: 25527408
- PMCID: PMC4328749
- DOI: 10.15252/embr.201439458
RNA-processing proteins regulate Mec1/ATR activation by promoting generation of RPA-coated ssDNA
Abstract
Eukaryotic cells respond to DNA double-strand breaks (DSBs) by activating a checkpoint that depends on the protein kinases Tel1/ATM and Mec1/ATR. Mec1/ATR is activated by RPA-coated single-stranded DNA (ssDNA), which arises upon nucleolytic degradation (resection) of the DSB. Emerging evidences indicate that RNA-processing factors play critical, yet poorly understood, roles in genomic stability. Here, we provide evidence that the Saccharomyces cerevisiae RNA decay factors Xrn1, Rrp6 and Trf4 regulate Mec1/ATR activation by promoting generation of RPA-coated ssDNA. The lack of Xrn1 inhibits ssDNA generation at the DSB by preventing the loading of the MRX complex. By contrast, DSB resection is not affected in the absence of Rrp6 or Trf4, but their lack impairs the recruitment of RPA, and therefore of Mec1, to the DSB. Rrp6 and Trf4 inactivation affects neither Rad51/Rad52 association nor DSB repair by homologous recombination (HR), suggesting that full Mec1 activation requires higher amount of RPA-coated ssDNA than HR-mediated repair. Noteworthy, deep transcriptome analyses do not identify common misregulated gene expression that could explain the observed phenotypes. Our results provide a novel link between RNA processing and genome stability.
Keywords: DNA damage checkpoint; DNA double‐strand breaks; Rrp6; Trf4; Xrn1.
© 2014 The Authors.
Figures

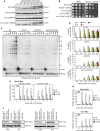
Sensitivity to phleomycin. Serial dilutions (1:10) of exponentially growing cell cultures were spotted out onto YEPD plates with or without phleomycin (phleo).
Rad53 phosphorylation after a DSB at the MAT locus. YEPR exponentially growing cell cultures of JKM139 derivative strains, carrying the HO cut site at the MAT locus, were transferred to YEPRG at time zero. Protein extracts from samples taken at the indicated times after HO induction were subjected to Western blot analysis with anti-Rad53 antibodies.
Checkpoint-mediated cell cycle arrest. G1-arrested JKM139 derivative cells were plated on galactose-containing plates at time zero. Two hundred cells for each strain were analyzed to determine the frequency of cells that were unbudded, large budded or forming microcolonies with more than two cells.
Analysis of cell cycle progression in unperturbed conditions. Cell cultures arrested in G1 with α-factor were released into YEPD at time zero. FACS analysis of DNA content.
Checkpoint activation in G2-arrested cells. As in (B) except that HO was induced in nocodazole-arrested JKM139 derivative cells that were kept arrested in G2 in the presence of nocodazole throughout the experiment.
Rad53 phosphorylation after a DSB at the LEU2 locus. As in (B), but inducing HO expression in YFP17 derivative strains, which carry the HO cut site at the LEU2 locus.
Checkpoint activation. Protein extracts from JKM139 derivative strains containing the indicated centromeric plasmids were subjected to Western blot analysis with anti-Rad53 antibodies at different time points after HO induction.
Ddc2 phosphorylation after a DSB at the MAT locus. Protein extracts from JKM139 derivative strains expressing fully functional Ddc2-HA were subjected to Western blot analysis with anti-HA antibodies at different time points after HO induction.

Checkpoint activation. Protein extracts from JKM139 derivative strains containing the indicated centromeric plasmids were subjected to Western blot analysis with anti-Rad53 antibodies at different time points after HO induction.
Sensitivity to phleomycin. Strains in (A) were serially diluted (1:10) and spotted out onto YEPD plates with or without phleomycin.
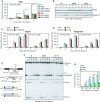
DSB resection. YEPR exponentially growing cultures of JKM139 derivative cells were transferred to YEPRG at time zero. Gel blots of SspI-digested genomic DNA separated on alkaline agarose gel were hybridized with a single-stranded RNA probe that anneals to the unresected strand on one side of the break. 5′–3′ resection progressively eliminates SspI sites (S), producing larger SspI fragments (r1 through r7) detected by the probe.
Densitometric analyses. The experiment as in (C) was independently repeated three times and the mean values are represented with error bars denoting SD (n = 3).
Mre11-Myc recruitment at the HO-induced DSB. In all diagrams, data are expressed as fold enrichment at the HO-induced DSB over that at the non-cleaved ARO1 locus, after normalization of ChIP signals to the corresponding input for each time point. The mean values are represented with error bars denoting SD (n = 3). *P < 0.01, t-test.
MRX complex formation. Protein extracts were analyzed by Western blot with anti-Myc or anti-HA antibodies either directly (Total) or after Mre11-Myc immunoprecipitation (IPs) with anti-Myc antibodies.
Mre11 recruitment at the HO-induced DSB in G1-arrested xrn1Δ cells. ChIP analysis was performed as in (E) except that HO was induced in α-factor-arrested JKM139 derivative cells kept arrested in G1 with α-factor throughout the experiment. qPCR was performed at 1.8 kb from the DSB. The mean values are represented with error bars denoting SD (n = 3). *P < 0.01, t-test.

DSB resection. Genomic DNA was analyzed for ssDNA formation as described in Fig2C.
Densitometric analyses. The experiment as in (A) was independently repeated three times and the mean values are represented with error bars denoting SD (n = 3).
Mec1-Myc recruitment at the HO-induced DSB. In all diagrams, data are expressed as fold enrichment at the HO-induced DSB over that at the non-cleaved ARO1 locus, after normalization of ChIP signals to the corresponding input for each time point. The mean values are represented with error bars denoting SD (n = 3). *P < 0.01, t-test.
Rpa1 recruitment at the HO-induced DSB. ChIP analysis was performed as in (C). The mean values are represented with error bars denoting SD (n = 3). *P < 0.01, t-test.
Mec1 protein level. Western blot with anti-Myc antibodies of extracts used for the ChIP analysis shown in (C).
Rpa1, Rpa2 and Rpa3 protein levels. Western blot with anti-Rpa1, anti-Rpa2 and anti-HA antibodies of extracts used for the ChIP analysis in (D).
RPA complex formation. Protein extracts were analyzed by Western blotting with anti-HA (Rpa3), anti-Rpa1 or anti-Rpa2 antibodies either directly (Total) or after Rpa3-HA immunoprecipitation (IPs) with anti-HA antibodies.
Checkpoint activation in response to HU and MMS treatment. Western blot analysis with anti-Rad53 antibodies of protein extracts prepared from exponentially growing cells that were treated with HU or MMS for the indicated time points.

Recruitment of Rpa1 at the HO-induced DSB. ChIP analysis was performed as in Fig3D. The mean values are represented with error bars denoting SD (n = 3). *P < 0.01, t-test.
Rad51 and Rad52 protein levels. Western blot with anti-Rad51 and anti-HA antibodies of extracts used for the ChIP analysis in (C) and (D), respectively.
Recruitment of Rad51 and Rad52-HA at the HO-induced DSB. ChIP analysis was performed as in Fig3. The mean values are represented with error bars denoting SD (n = 3). *P < 0.01, t-test.
System to detect CO and NCO. Galactose-induced HO generates a DSB at the MATa locus on chromosome V that is repaired by using the homologous MATa-inc region on chromosome III. Sizes of EcoRI (E) DNA fragments detected by the probe are indicated.
Detection of DSB repair products. EcoRI-digested genomic DNA from samples taken at the indicated times after HO induction was subjected to Southern blot analysis with the MATa probe depicted in (E). *indicates a cross hybridization signal.
Densitometric analysis of the repair signals. The mean values are represented with error bars denoting SD (n = 3). *P < 0.01, t-test.

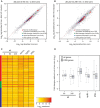
Expression of DDR genes in wild-type cells 60 min after HO induction. Scatter plot of tag density for genes encoding DDR factors in wild-type strain (JKM139) before (time zero) and after (60 min) HO induction. Results are presented as log2 of density, expressed in tag per nucleotide. Spearman's correlation coefficients for each set of genes are indicated.
Expression of DDR genes in wild-type cells 240 min after HO induction. Same as in (A) using JKM139 cells at time zero and 240 min after HO induction.
Expression of DDR genes in wild-type cells at time zero, 60 and 240 min after HO induction, and in xrn1Δ, rrp6Δ and trf4Δ cells at time zero. Data are presented as a heatmap and genes are clustered according the classification used in (A), with the same color code.
Global expression of all protein-coding and DDR genes upon HO induction or inactivation of RNA decay factors. Box plot representation of expression fold change for all protein-coding (white) and DDR (gray) genes in wild-type cells 60 and 240 min after HO induction, and in xrn1Δ, rrp6Δ and trf4Δ mutants at time zero. All fold changes are relative to the wild-type at time zero. For each condition, the black line within the box corresponds to the median value, while the top and bottom lines of the box correspond to the upper quartile and lower quartile, respectively (n = 5,798 for all genes and n = 194 for the DDR genes). Outliers are not represented.
References
MeSH terms
Substances
Associated data
- Actions
Grants and funding
LinkOut - more resources
Full Text Sources
Other Literature Sources
Molecular Biology Databases
Research Materials
Miscellaneous

