Review
. 2015;67(1):198-213.
doi: 10.1124/pr.114.009944.

What can crystal structures of aminergic receptors tell us about designing subtype-selective ligands?

Affiliations
Review

What can crystal structures of aminergic receptors tell us about designing subtype-selective ligands?

Mayako Michino et al. Pharmacol Rev. 2015.

Abstract

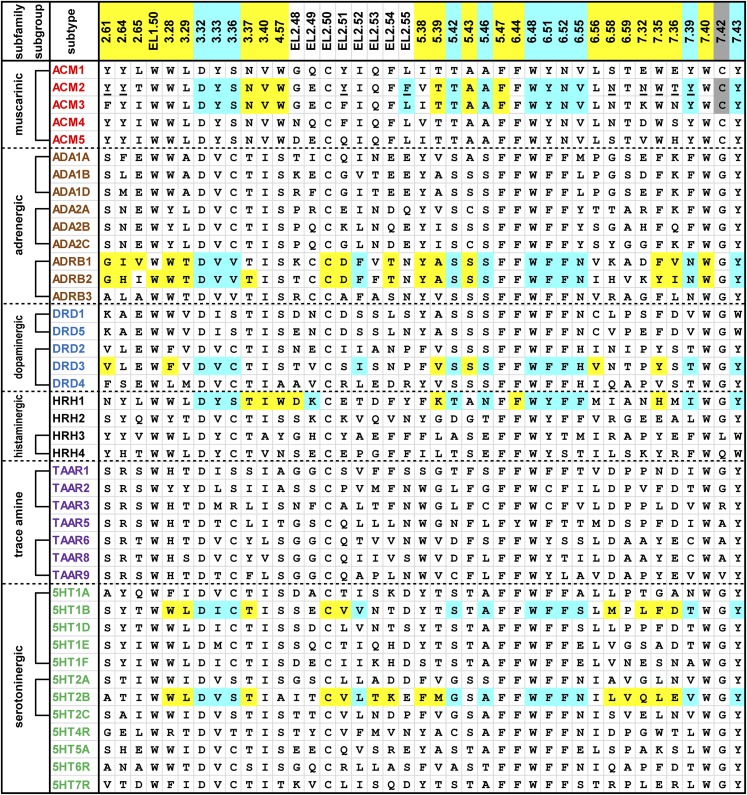
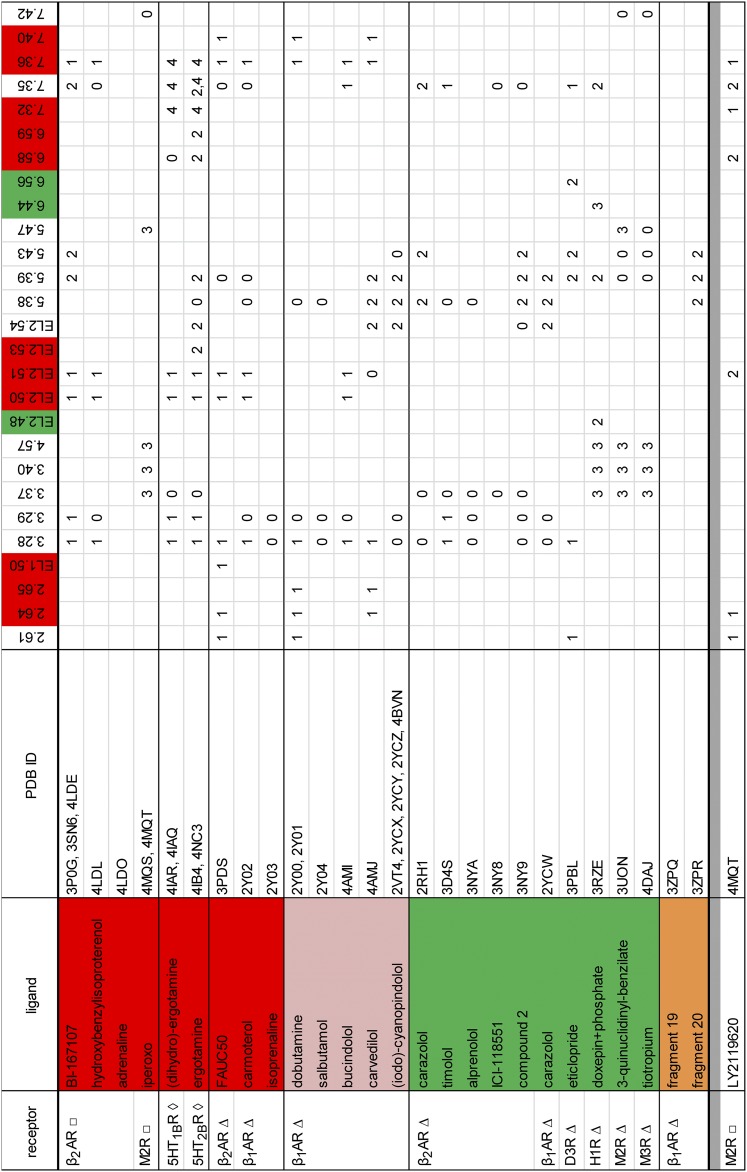
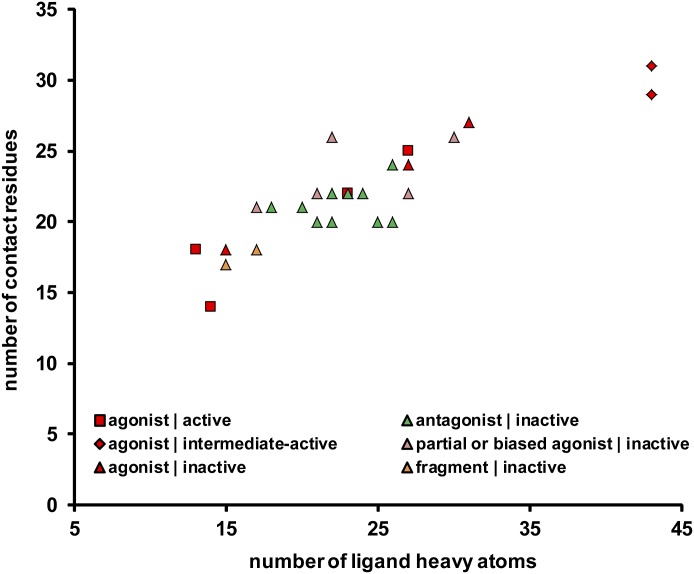
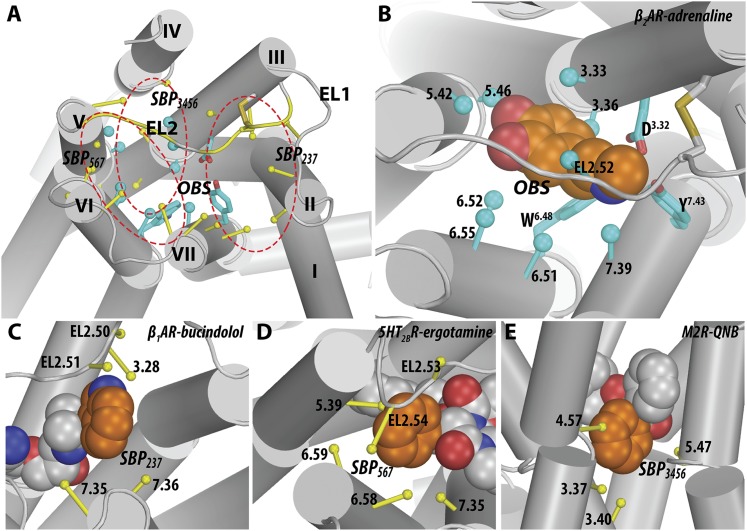
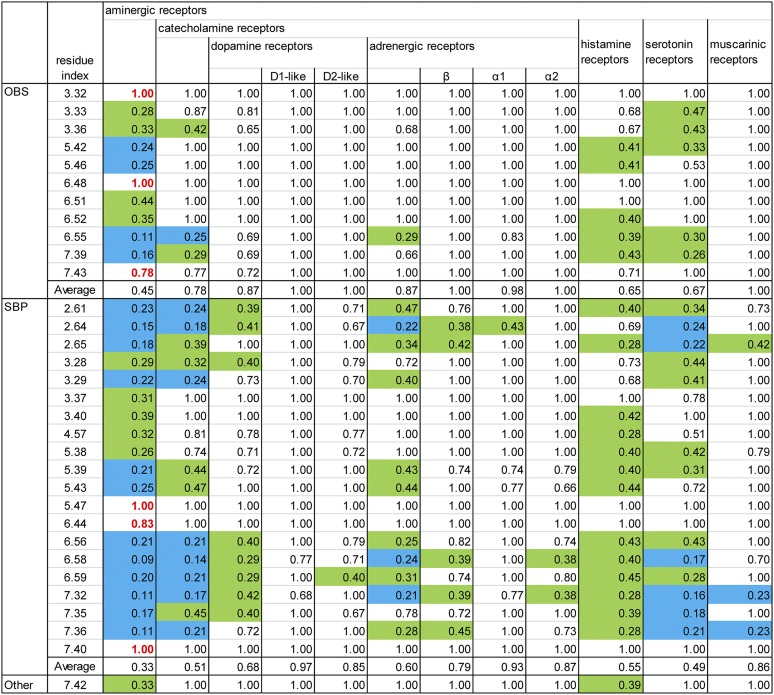
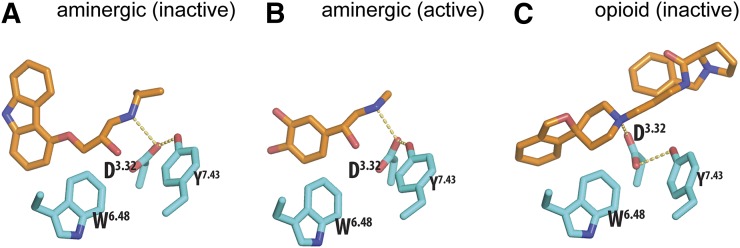
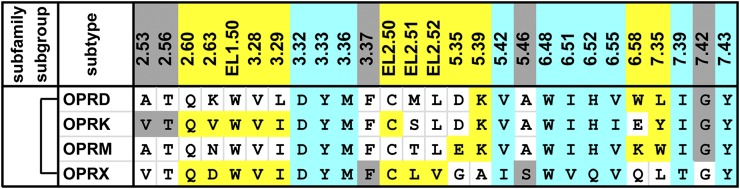
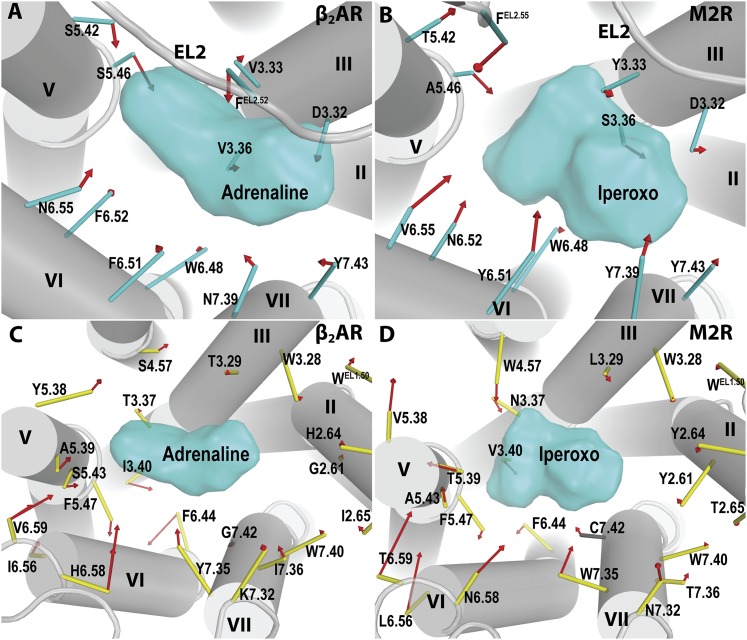
G protein-coupled receptors (GPCRs) are integral membrane proteins that represent an important class of drug targets. In particular, aminergic GPCRs interact with a significant portion of drugs currently on the market. However, most drugs that target these receptors are associated with undesirable side effects, which are due in part to promiscuous interactions with close homologs of the intended target receptors. Here, based on a systematic analysis of all 37 of the currently available high-resolution crystal structures of aminergic GPCRs, we review structural elements that contribute to and can be exploited for designing subtype-selective compounds. We describe the roles of secondary binding pockets (SBPs), as well as differences in ligand entry pathways to the orthosteric binding site, in determining selectivity. In addition, using the available crystal structures, we have identified conformational changes in the SBPs that are associated with receptor activation and explore the implications of these changes for the rational development of selective ligands with tailored efficacy.


Figures

Fig. 1.
Fig. 1.
Alignment of the ligand-contacting residues in the 42 human aminergic receptors. An analysis of ligand-contacting residues was carried out for all 36 available ligand-bound crystal structures of aminergic receptors. The residue positions are indicated by the Ballesteros-Weinstein numbers at the top of each column (for EL2, the residues are indexed relative to the conserved Cys residue, EL2.50, which makes a disulfide bond to Cys3.25) and colored by the classification of the positions: OBS positions (see section II.A) in cyan, SBP positions (see section II.B) in yellow, and 7.42, which contacts ligand but is not in the OBS or any SBP, in gray (see Fig. 2). The OBS positions were defined as the common set of positions identified by the SASA analysis in all structures except for the agonist-bound M2R structures (PDB IDs 4MQS and 4MQT). The SASA values for each residue were calculated using the program Naccess (Hubbard and Thornton, 1993), with probe size of 1.4 Å, Z-slice of 0.001; we used a cutoff of 0.2% to identify the residues with different accessibility in the presence and absence of bound ligand. Note that the OBS includes one residue from EL2 approximately at position EL2.52—although in the H1R structure (PDB ID 3RZE) or the antagonist-bound M2R and M3R structures (PDB IDs 3UON and 4DAJ) EL2.52 does not face the OBS, the residue at EL2.49 or EL2.55 contacts ligand in a manner similar to the residues at EL2.52 in other structures. The receptors are indicated by their UniProt entry names and colored by subfamily. We define a subgroup within a subfamily, indicated by brackets, to be a set of receptors in which all the pairwise sequence identities of the TM domain are >45%. The residues that contact a ligand in any of the structures for a particular receptor are shaded in cyan, yellow, or gray as described above. The residues interacting with the positive allosteric modulator LY2119620 in the M2R structure (PDB ID 4MQT) are underlined, except for Glu172EL2.46 and Ala414EL3, which are not shown. All the amino acid sequences are human; for β1AR and M3R, however, the contact residues were identified in the crystal structures of turkey β1AR and rat M3R.
Fig. 2.
Fig. 2.
Identification of SBPs in the crystal structures of aminergic receptors. The numbered (“0” to “4”) positions for each complex indicate the residues outside of the OBS (non-OBS) that interact with a specific ligand moiety—the closest distance between any heavy atoms of the residue and a ligand moiety is within the van der Waals interaction distance, which we define in this study to be the sum of the van der Waals radii plus 0.8 Å. A SBP was identified as a cluster of ≥3 non-OBS residues that interact with a small ligand moiety, which we defined as a set of ligand heavy atoms with the largest pairwise distance between any pair <4.2 Å (the largest pairwise distance within a hydroxyphenyl moiety). “0” indicates the residue is not within any SBP in that structure, “1” to “4” indicate the involvement of the residue in forming a particular SBP (“1,” “SBP237”; “2,” “SBP567”; “3,” “SBP3456”, “4,” “SBP7”). These SBPs are classified according to their location and named according to the surrounding TMs (see Fig. 4 for the representatives of “1” to “3”); thus, in a particular complex, a ligand moiety does not necessarily interact with every surrounding TM. The structures are arranged according to the conformational state of the receptor (i.e., active, intermediate-active, and inactive, which are indicated by □, ◇, and ∆, respectively) and the ligand efficacy (i.e., agonist in red, partial or biased agonist in pink, and antagonist/inverse agonist in green). The residue sets from the structures for the same receptor bound with the same or highly similar ligand are combined, e.g., the structures with PDB IDs 3P0G, 3SN6, and 4LDE are all β2AR in complex with BI-167107. The fragments bound to β1AR are categorized separately as their efficacies were unknown (colored in orange) (Christopher et al., 2013). The phosphate ion in the H1R structure (PDB ID 3RZE) is counted as an extension of the orthosteric ligand (Shimamura et al., 2011). The positions in the top row are colored if they only interact with either agonists/partial agonists (red) or antagonists/inverse agonists (green).
Fig. 3.
Fig. 3.
Statistics of ligand-contacting residues. The number of contact residues is plotted against ligand size for the 36 available ligand-receptor complexes. The color and shape of each point indicate the ligand efficacy and the receptor conformational state, respectively, as specified in Fig. 2. Although the number of contact residues is correlated with ligand size, the ligand efficacy is not correlated with ligand size.
Fig. 4.
Fig. 4.
The orthosteric binding site and secondary binding pockets. (A) All the identified ligand-contacting positions for the aminergic receptors are mapped onto a β2AR structure (PDB ID 4LDO). The 12 OBS residues are in cyan, and the SBP residues are in yellow. Three representative SBPs shown in (C–E) are indicated by red dotted circles. (B) A zoomed-in view of the OBS in the β2AR bound with adrenaline (PDB ID 4LDO). The side chains of the three highly conserved residues within the aminergic family, Asp3.32, Trp6.48, and Tyr7.43, and the conserved EL2.50-Cys3.25 disulfide bond are shown as sticks; for all other residues, sticks were drawn from the Cα to the center of mass (represented as spheres) of the heavy atoms of the side chain. The zoomed-in views of the SBPs, “SBP237” (C), “SBP567” (D), “SBP3456” (E), are shown in representative structures [PDB IDs 4AMI (C), 4IB4 (D), 3UON (E)]. The SBPs are classified according to their locations and named according to the surrounding TMs (see Fig. 2). The ligands in the respective structures are in spheres with the carbon atoms of adrenaline (B) or the moieties occupying the SBPs (C–E) colored in orange.
Fig. 5.
Fig. 5.
Conservation of ligand-contacting residues. The conservation indices (CI) of ligand-contacting residues across the aminergic receptors and within the indicated subfamilies and subgroups are calculated by the ProperTM server (Shi et al., 2001; Beuming and Weinstein, 2004). The positions with low sequence conservation are indicated by filled colors (CI values ≤ 0.25 in light blue, and those between 0.25 and 0.50 in light green). The highly conserved positions among all amine receptors with CI > 0.75 are highlighted in red. Note, at the aminergic receptor family level, except for Asp3.32, Trp6.48, Tyr/Trp7.43, other OBS positions are not more conserved than SBP positions.
Fig. 6.
Fig. 6.
The highly conserved residues in the OBS. The highly conserved OBS residues (see Fig. 5) Asp3.32, Trp6.48, Tyr/Trp7.43 (cyan) are shown as sticks in the inactive (PDB ID 2RH1) (A) and active (PDB ID 4LDO) (B) structures of β2AR. Asp3.32 forms a hydrogen bond with Tyr7.43 in all available crystal structures of aminergic receptors, suggesting that this interaction is likely to be critical for ligand-recognition of this family. This triad is similarly conserved in the opioid receptor family, as exemplified in the structure of nociceptin opioid receptor bound to a peptide-mimetic compound (PDB ID 4EA3) (C). The ligands are shown as orange sticks; the hydrogen bonds between the nitrogen atoms of the positively charged amine groups and Asp3.32 or between Asp3.32 and Tyr7.43 are indicated by dotted lines.
Fig. 7.
Fig. 7.
Alignment of the ligand-contacting residues in the four opioid receptors. The ligand-contacting residues were identified by SASA analysis for all five available crystal structures of opioid receptors. The residue positions are indicated by the Ballesteros-Weinstein numbers at the top of each column (for EL2, the residues are indexed relative to the conserved Cys residue, EL2.50, which makes a disulfide bond to Cys3.25) and colored by the classification of the positions: OBS positions in cyan, SBP positions in yellow, and the remaining positions in gray. The OBS and SBP positions were identified similarly to those in the aminergic receptors. Note the identified ligand-contacting residues are similar to those previously summarized (Filizola and Devi, 2013). The bracket on the left indicates high pairwise sequence identities of >60% among all four receptors. The receptors are indicated by their UniProt entry names. All the amino acid sequences are human; for the µ-opioid receptor (OPRM), the contact residues are identified in the crystal structure of mouse OPRM.
Fig. 8.
Fig. 8.
Rearrangements of binding site residues in the conformational transition from the inactive state to the active state. The rearrangements in the OBS (A and B) and SBPs (C and D) between the inactive and active structures of β2AR (PDB IDs 2RH1 and 4LDE/4LDO) (A and C) and M2R (PDB IDs 3UON and 4MQT) (B and D) are shown. The color coding of residues is the same as in Fig. 1. For simplicity, EL2 is not shown in (C and D). The agonists bound in the active-state structures are represented as cyan surfaces to indicate the space occupied by the OBS. For clarity, only the backbones of the inactive-state structures are shown in gray cartoon representation, whereas the active-state structures are superimposed to the corresponding inactive-state structures by the Cα atoms of 70 TM residue positions that undergo the smallest changes between the inactive and active states. To select these positions, we ranked the distance changes of the corresponding Cα atoms in the inactive and active structures, after aligning them by TM residues using the iterative-fit “align” command in PyMOL (version 1.3r1; Schrödinger LLC, New York, NY). This ranking has been carried out for both β2AR and M2R structures pairs; the 70 highest ranked positions were selected after averaging the ranks from both receptor comparisons and ensuring that at least two positions from each TM were included. The ligand-binding site residues are represented as sticks, drawn from the Cα atom to the COM of the side chain heavy atoms of the residue (for Gly, only the Cα atom is shown). The red arrows indicate the conformational changes from the inactive to the active state for the COM of each residue. In (C), two arrows are drawn for each of the positions 6.58 and 6.59, showing the differing conformational changes to the BI-167107–bound active-state (PDB ID 4LDE) compared with the adrenaline-bound active-state (PDB ID 4LDO) for β2AR.

References

    1. Abdul-Ridha A, Lane JR, Mistry SN, Lopez L, Sexton PM, Scammells PJ, Christopoulos A, Canals M. (2014) Mechanistic insights into allosteric structure-function relationships at the M1 muscarinic acetylcholine receptor. J Biol Chem 89:33701–33711. - PMC - PubMed
    1. Ahlquist RP. (1948) A study of the adrenotropic receptors. Am J Physiol 153:586–600. - PubMed
    1. Baker JG. (2005) The selectivity of beta-adrenoceptor antagonists at the human beta1, beta2 and beta3 adrenoceptors. Br J Pharmacol 144:317–322. - PMC - PubMed
    1. Baker JG. (2010) The selectivity of beta-adrenoceptor agonists at human beta1-, beta2- and beta3-adrenoceptors. Br J Pharmacol 160:1048–1061. - PMC - PubMed
    1. Baker JG, Proudman RG, Hill SJ. (2015) Salmeterol's extreme beta2-selectivity is due to residues in both extracellular loops and transmembrane domains. Mol Pharmacol 87:103–120. - PubMed

Publication types