

Palmitoleic acid is elevated in fatty liver disease and reflects hepatic lipogenesis
- PMID: 25527748
- PMCID: PMC4266891
- DOI: 10.3945/ajcn.114.092262
Palmitoleic acid is elevated in fatty liver disease and reflects hepatic lipogenesis
Abstract
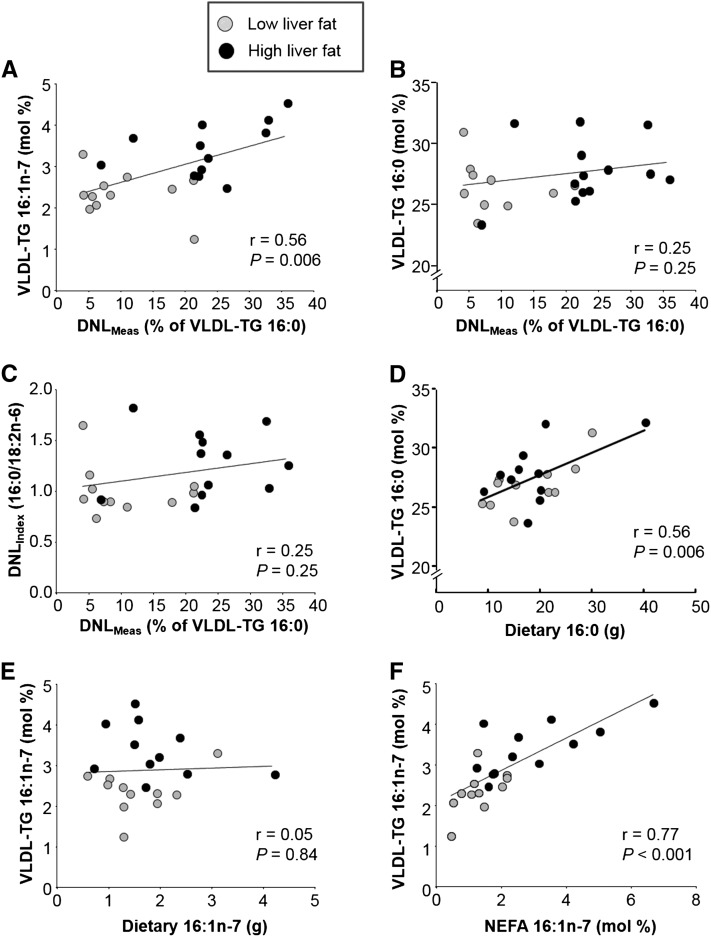
Background: Biochemical evidence has linked the coordinate control of fatty acid (FA) synthesis with the activity of stearoyl-CoA desaturase-1 (SCD1). The ratio of 16:1n-7 to 16:0 [SCD1₁₆] in plasma triacylglycerol FA has been used as an index to reflect liver SCD1₁₆ activity and has been proposed as a biomarker of FA synthesis, although this use has not been validated by comparison with isotopically measured de novo lipogenesis (DNL(Meas)).
Objective: We investigated plasma lipid 16:1n-7 and FA indexes of elongation and desaturation in relation to lipogenesis.
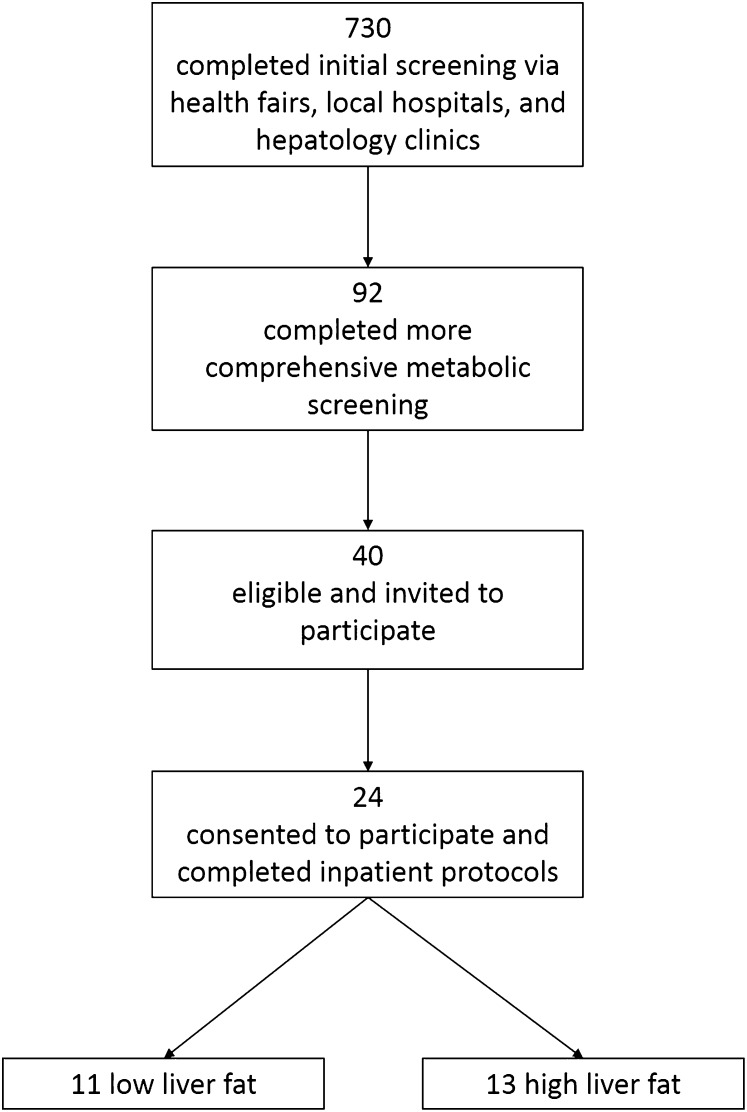
Design: In this cross-sectional investigation of metabolism, 24 overweight adults, who were likely to have elevated DNL, consumed D2O for 10 d and had liver fat (LF) measured by magnetic resonance spectroscopy. Very-low-density lipoprotein (VLDL)-triacylglycerols and plasma free FA [nonesterified fatty acids (NEFAs)] were analyzed by using gas chromatography for the FA composition (molar percentage) and gas chromatography-mass spectrometry and gas chromatography-combustion isotope ratio mass spectrometry for deuterium enrichment.
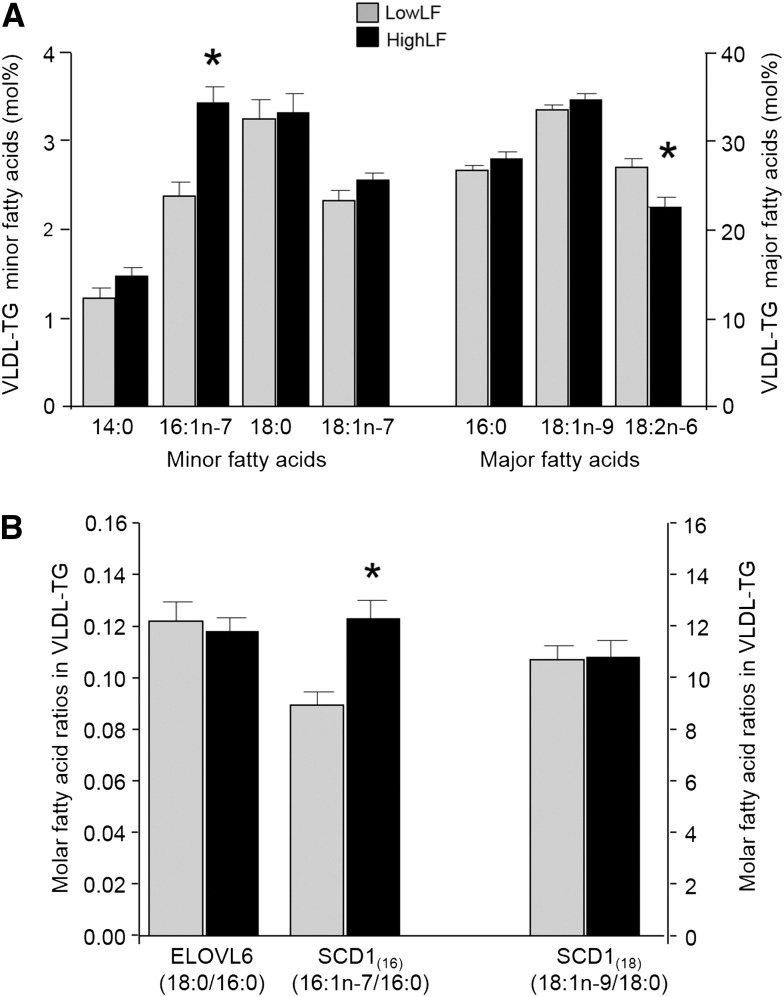
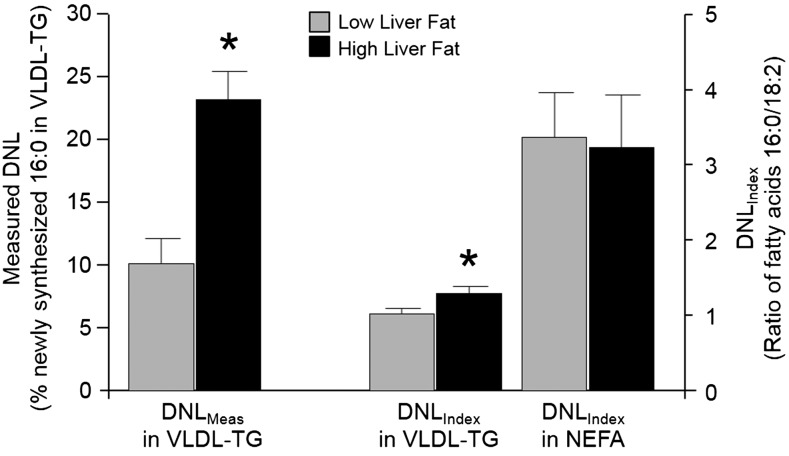
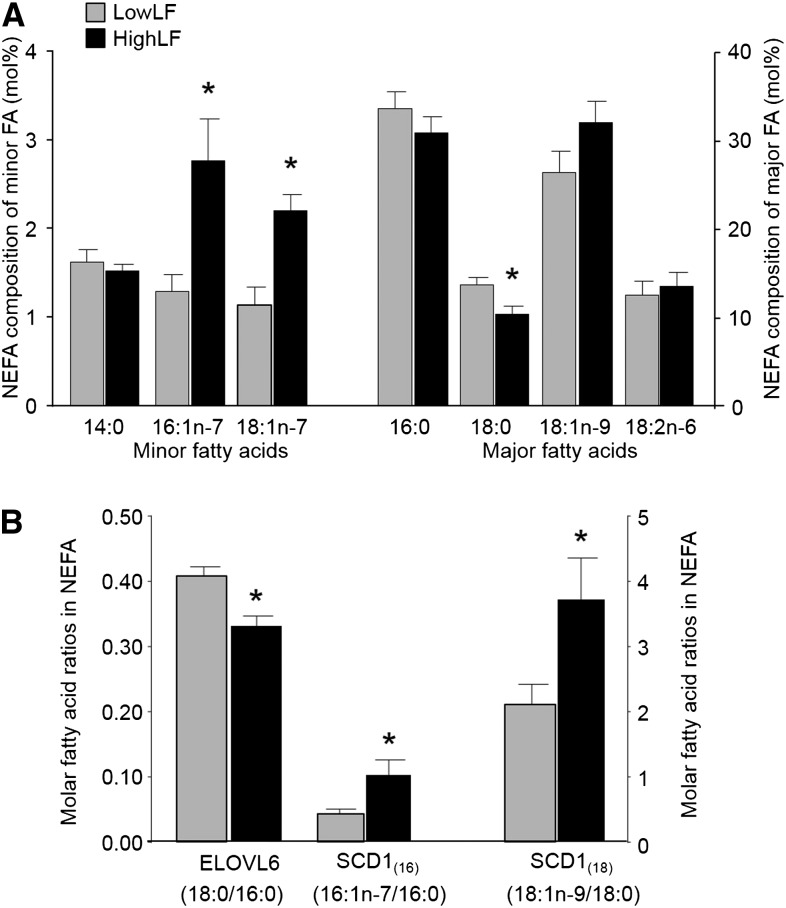
Results: In all subjects, VLDL-triacylglycerol 16:1n-7 was significantly (P < 0.01) related to DNL(Meas) (r = 0.56), liver fat (r = 0.53), and adipose insulin resistance (r = 0.56); similar positive relations were shown with the SCD1₁₆ index, and the pattern in NEFAs echoed that of VLDL-triacylglycerols. Compared with subjects with low LF (3.1 ± 2.7%; n = 11), subjects with high LF (18.4 ± 3.6%; n = 13) exhibited a 45% higher VLDL-triacylglycerol 16:1n-7 molar percentage (P < 0.01), 16% of subjects had lower 18:2n-6 (P = 0.01), and 27% of subjects had higher DNL as assessed by using a published DNL index (ratio of 16:0 to 18:2n-6; P = 0.03), which was isotopically confirmed by DNL(Meas) (increased 2.5-fold; P < 0.01). Compared with 16:0 in the diet, the low amount of dietary 16:1n-7 in VLDL-triacylglycerols corresponded to a stronger signal of elevated DNL.
Conclusion: The current data provide support for the use of the VLDL-triacylglycerol 16:1n-7 molar percentage as a biomarker for elevated liver fat when isotope use is not feasible; however, larger-scale confirmatory studies are needed.
Trial registration: ClinicalTrials.gov NCT01371396.
Keywords: VLDL triacylglycerol; biomarker; lipogenesis; palmitoleic fatty acid; stearoyl-CoA desaturase.
© 2015 American Society for Nutrition.
Figures
References
-
- Diraison F, Moulin P, Beylot M. Contribution of hepatic de novo lipogenesis and reesterification of plasma non esterified fatty acids to plasma triglyceride synthesis during non–alcoholic fatty liver disease. Diabetes Metab 2003;29:478–85. - PubMed
-
- Schwarz J-M, Linfoot P, Dare D, Aghajanian K. Hepatic de novo lipogenesis in normoinsulinemic and hyperinsulinemic subjects consuming high-fat, low-carbohydrate and low-fat, high-carbohydrate isoenergetic diets. Am J Clin Nutr 2003;77:43–50. - PubMed
-
- Wilke MS, French MA, Goh YK, Ryan EA, Jones PJ, Clandinin MT. Synthesis of specific fatty acids contributes to VLDL-triacylglycerol composition in humans with and without type 2 diabetes. Diabetologia 2009;52:1628–37. - PubMed
-
- Vedala A, Wang W, Neese RA, Christiansen MP, Hellerstein MK. Delayed secretory pathway contributions to VLDL-triglycerides from plasma NEFA, diet, and de novo lipogenesis in humans. J Lipid Res 2006;47:2562–74. - PubMed
Publication types
MeSH terms
Substances
Associated data
Grants and funding
LinkOut - more resources
Full Text Sources
Other Literature Sources
Medical
