

Food neophobia associates with lower dietary quality and higher BMI in Finnish adults
- PMID: 25529274
- PMCID: PMC10271395
- DOI: 10.1017/S1368980014003024
Food neophobia associates with lower dietary quality and higher BMI in Finnish adults
Abstract
Objective: Food neophobia has been associated with decreased consumption of vegetables mainly among children. We hypothesized that food neophobia in adults is also associated with lower overall dietary quality and higher BMI.
Design: Data for the present cross-sectional analyses were derived from parents in a follow-up family study.
Setting: The STEPS study, a longitudinal study of health and development of a cohort of children born in south-west Finland.
Subjects: The parents, 1178 women (age 19-45 years, mean 32·2 years) and 1013 men (age 18-57 years, mean 34·1 years), completed a questionnaire at home when their child was 13 months old. The questionnaire included the Food Neophobia Scale (FNS; range 10-70), the Index of Diet Quality (IDQ; range 0-16) and a measure of fruit and vegetable consumption. At that time the participants' height and weight were also measured by a research nurse to calculate BMI.
Results: Compared with the food neophilics (FNS score 10-24), the food neophobics (FNS score 40-70) consumed fewer vegetables (women: 15 v. 10 portions/week; men: 13 v. 7 portions/week), scored lower on the IDQ (women: 9·7 v. 8·5; men: 8·8 v. 7·8) and had higher BMI (women: 24·2 v. 26·0 kg/m²; men: 26·5 v. 27·5 kg/m²) as tested by one-way ANOVA, with all P values <0·001 in women and <0·05 in men. The food neophobics followed a diet lower in nutritional quality than did the food neophilics, especially regarding vegetables.
Conclusions: Food neophobia may complicate adaptation to dietary recommendations and predispose to overweight.
Keywords: Diet quality; Food neophobia; STEPS study; Vegetable consumption.
Figures
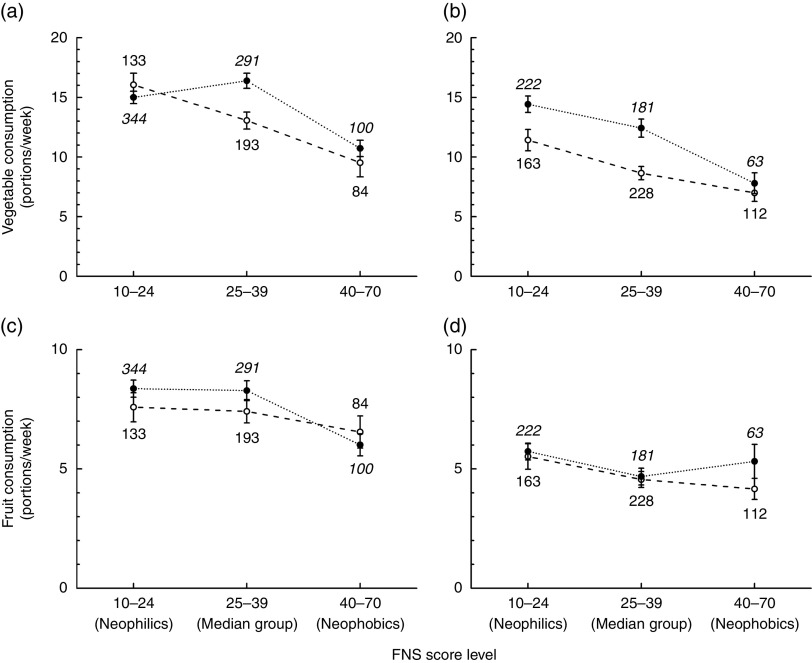
 , basic/vocational, group sizes in standard font;
  , advanced/academic, group sizes in italic font) and gender (a, c, women; b, d, men); analyses based on data from 1178 women and 1013 men, parents in the STEPS longitudinal cohort study, south-west Finland. Values are means, with their standard errors represented by vertical bars; numbers next to the symbols denote group sizes. Statistics from the two-way ANOVA: (a) FNS: F[2,1139]=18·65, P<0·001; Edu: F[1,1139]=2·87, P=0·091; FNS×Edu: F[2,1139]=4·91, P=0·007. (b) FNS: F[2,963]=19·22, P< 0·001; Edu: F[1,963]=13·68, P<0·001; FNS × Edu: F[2,963]=1·37, P=0·25. (c) FNS: F[2,1139]=4·53, P=0·011; Edu: F[1,1139]=0·68, P=0·41; FNS×Edu: F[2,1139]=0·79, P=0·45. (d) FNS: F[2,963]=3·72, P=0·025; Edu: F[1,963]=1·69, P=0·19; FNS×Edu: F[2,963]=0·58, P=0·56
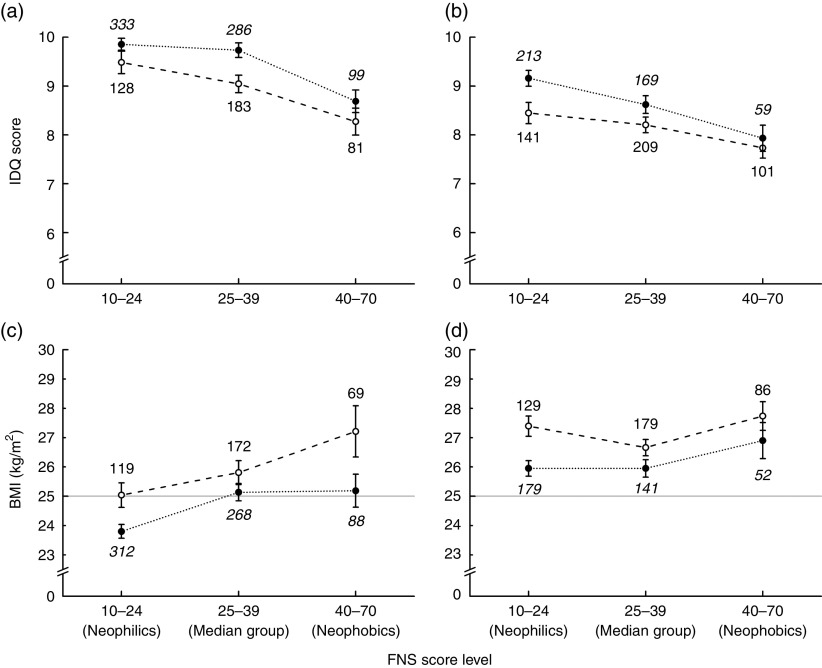
 , basic/vocational, group sizes in standard font;
  , advanced/academic, group sizes in italic font) and gender (a, c, women; b, d, men); analyses based on data from 1178 women and 1013 men, parents in the STEPS longitudinal cohort study, south-west Finland. Values are means, with their standard errors represented by vertical bars; numbers next to the symbols denote group sizes. Note that breaks are added to the vertical axes to show off differences between the groups (theoretical range of the IDQ score is 0–16). Lines
  in (c) and (d) highlight the conventional cut-off for overweight (BMI≥25 kg/m2). Statistics from the two-way ANOVA: (a) FNS: F[2,1104]=14·87, P<0·001; Edu: F[1,1104]=8·87, P=0·003; FNS×Edu: F[2,1104]=0·50, P=0·61. (b) FNS: F[2,886]=9·08, P<0·001; Edu: F[1,886]=6·53, P=0·011; FNS×Edu: F[2,886]=0·72, P=0·49. (c) FNS: F[2,1022]=8·09, P<0·001; Edu: F[1,1022]=13·42, P<0·001; FNS × Edu: F[2,1122]=1·10, P=0·33. (d) FNS: F[2,760]=3·21, P=0·041; Edu: F[1,760]=10·63, P=0·001; FNS×Edu: F[2,760]=0·75, P=0·47
References
-
- Pliner P & Hobden K (1992) Development of a scale to measure the trait of food neophobia in humans. Appetite 19, 105–120. - PubMed
-
- Cooke LJ, Haworth CMA & Wardle J (2007) Genetic and environmental influences on children’s food neophobia. Am J Clin Nutr 86, 428–433. - PubMed
-
- Knaapila A, Tuorila H, Silventoinen K et al. (2007) Food neophobia shows heritable variation in humans. Phys Behav 91, 573–578. - PubMed
-
- Knaapila A, Silventoinen K, Broms U et al. (2011) Food neophobia in young adults: genetic architecture and relation to personality, pleasantness and use frequency of foods, and body mass index – a twin study. Behav Genet 41, 512–521. - PubMed
Publication types
MeSH terms
LinkOut - more resources
Full Text Sources
Other Literature Sources
