. 2015 Jan 8;96(1):37-53.
doi: 10.1016/j.ajhg.2014.11.010. Epub 2014 Dec 18.

The genetic ancestry of African Americans, Latinos, and European Americans across the United States

Affiliations

The genetic ancestry of African Americans, Latinos, and European Americans across the United States

Katarzyna Bryc et al. Am J Hum Genet. .

Abstract

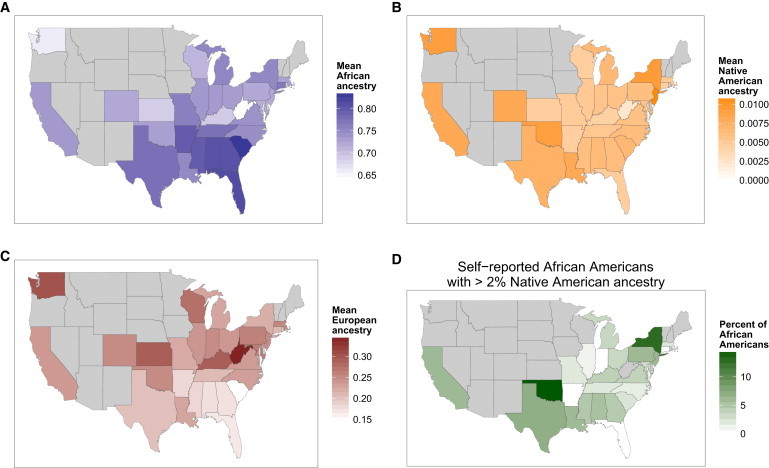
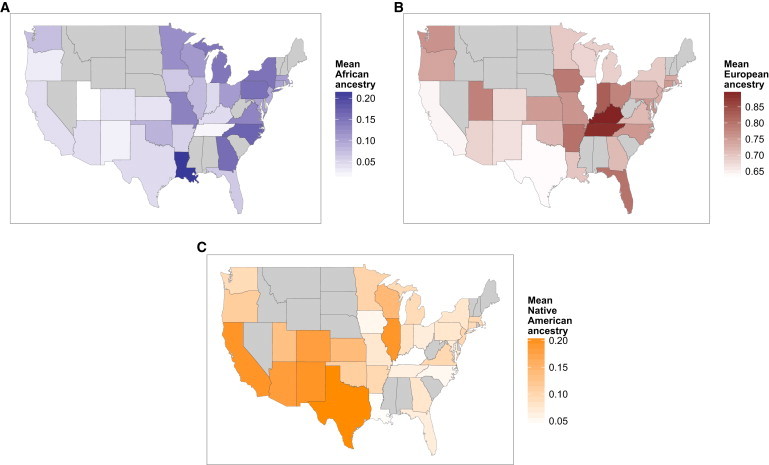
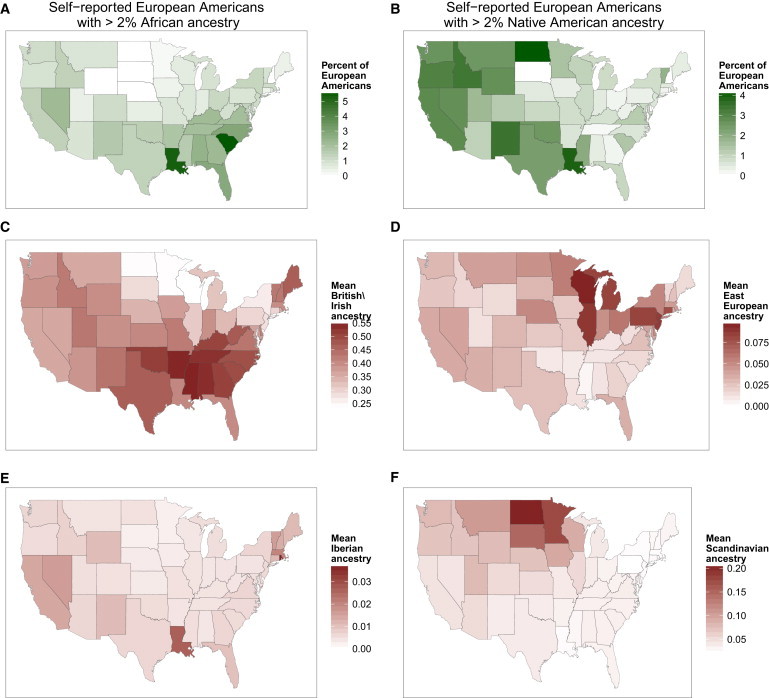
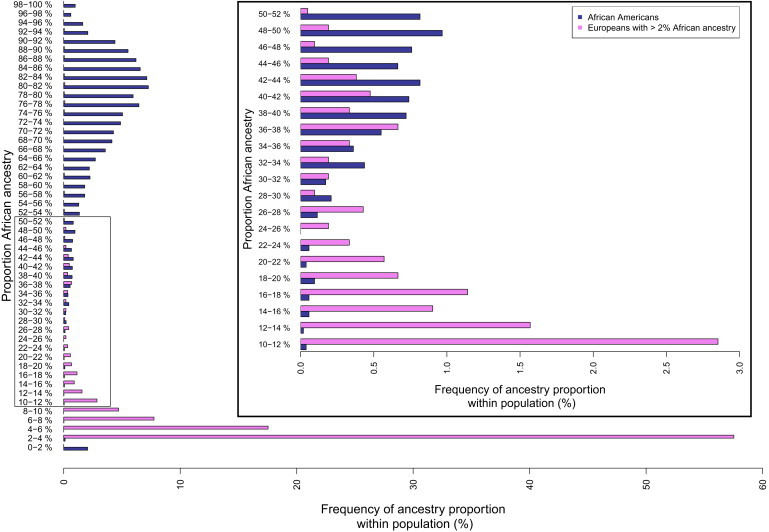
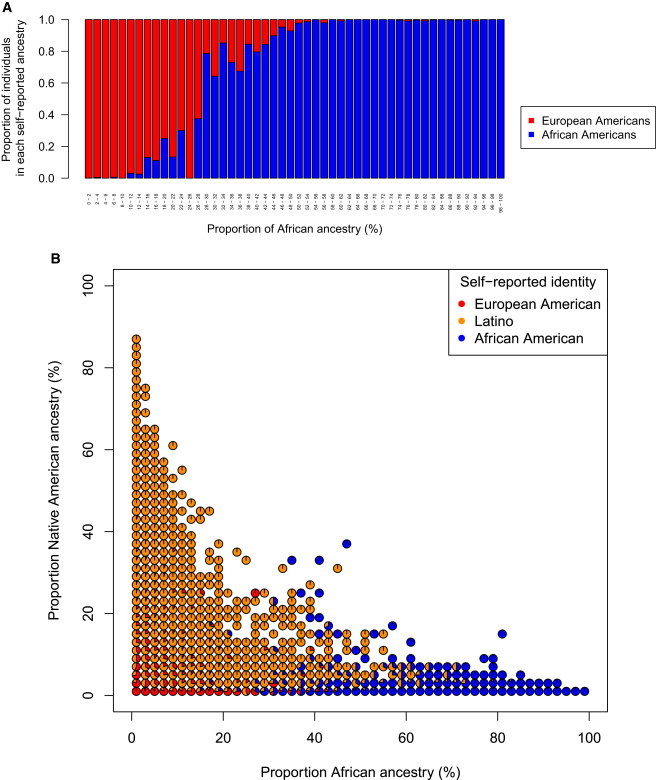
Over the past 500 years, North America has been the site of ongoing mixing of Native Americans, European settlers, and Africans (brought largely by the trans-Atlantic slave trade), shaping the early history of what became the United States. We studied the genetic ancestry of 5,269 self-described African Americans, 8,663 Latinos, and 148,789 European Americans who are 23andMe customers and show that the legacy of these historical interactions is visible in the genetic ancestry of present-day Americans. We document pervasive mixed ancestry and asymmetrical male and female ancestry contributions in all groups studied. We show that regional ancestry differences reflect historical events, such as early Spanish colonization, waves of immigration from many regions of Europe, and forced relocation of Native Americans within the US. This study sheds light on the fine-scale differences in ancestry within and across the United States and informs our understanding of the relationship between racial and ethnic identities and genetic ancestry.


Figures

Figure 1
Figure 1
The Distribution of Ancestry of Self-Reported African Americans across the US (A) Differences in levels of African ancestry in African Americans (blue). (B) Differences in levels of Native American ancestry in African Americans (orange). (C) Differences in levels of European ancestry of African Americans (red), from each state. States with fewer than ten individuals are excluded in gray. (D) The geographic distribution of self-reported African Americans with Native American ancestry. The proportion of African Americans in each state who have 2% or more Native American ancestry is shown by shade of green. States with fewer than 20 individuals are excluded in gray.
Figure 2
Figure 2
The Distribution of Ancestry of Self-Reported Latinos across the US Differences in mean levels of African (A), European (B), and Native American (C) ancestry in Latinos from each state is shown by shade of blue, red, and orange, respectively. States with fewer than ten individuals are excluded in gray.
Figure 3
Figure 3
Differences in African, Native American, and European Subpopulation Ancestry among Self-Reported European Americans from Different States (A) The geographic distribution of self-reported European Americans with African ancestry. The proportion of individuals with at least 2% African ancestry, out of the total number of European Americans per state, is shown by shade of green. (B) The geographic distribution of self-reported European Americans with Native American ancestry. The proportion of European Americans who have 2% or more Native American ancestry is shown for each state. (C–F) The mean British/Irish (C), Eastern European (D), Iberian (E), and Scandinavian (F) ancestry proportions among self-reported European Americans from each state are shown by shade of red.
Figure 4
Figure 4
Distribution of African Ancestry in African Americans and European Americans Histogram of African Americans (blue bars) and European Americans with ≥2% African ancestry (violet bars). Inset: Fine-scale histogram showing the region of greatest overlap between African Americans and European Americans, where African ancestry ranges from 10% and 52%. Both histograms have been normalized for each cohort to total 100%.
Figure 5
Figure 5
Proportions of Individual Self-Identities by Genome-wide Ancestry Proportions (A) The proportion of individuals that self-report as African American versus European American for each 2% bin of African ancestry. Each vertical bar corresponds to the individuals that carry that bin of ancestry, and is colored by the proportion of African American and European American identities. Proportions are estimated from absolute numbers of individuals, not scaled by total cohort size. (B) The proportion of individuals that self-report as European American, Latino, and African American for each 2% bin of African ancestry and Native American ancestry. The proportion for each 2% bin is shown as a pie chart, with slices colored in proportion to the absolute numbers of individuals from each self-reported identity that carry those levels of genome-wide ancestry. Pie charts are omitted for bins where there were no individuals with those corresponding levels of Native American and African ancestry.

References

    1. Moreno-Estrada A., Gignoux C.R., Fernández-López J.C., Zakharia F., Sikora M., Contreras A.V., Acuña-Alonzo V., Sandoval K., Eng C., Romero-Hidalgo S. Human genetics. The genetics of Mexico recapitulates Native American substructure and affects biomedical traits. Science. 2014;344:1280–1285. - PMC - PubMed
    1. Parra E.J. Admixture in North America. In: Suarez-Kurtz G., editor. Pharmacogenomics in Admixed Populations. Landes Bioscience; Austin: 2007. pp. 28–46.
    1. Parra E.J., Marcini A., Akey J., Martinson J., Batzer M.A., Cooper R., Forrester T., Allison D.B., Deka R., Ferrell R.E., Shriver M.D. Estimating African American admixture proportions by use of population-specific alleles. Am. J. Hum. Genet. 1998;63:1839–1851. - PMC - PubMed
    1. Smith M.W., Patterson N., Lautenberger J.A., Truelove A.L., McDonald G.J., Waliszewska A., Kessing B.D., Malasky M.J., Scafe C., Le E. A high-density admixture map for disease gene discovery in african americans. Am. J. Hum. Genet. 2004;74:1001–1013. - PMC - PubMed
    1. Parra E.J., Kittles R.A., Argyropoulos G., Pfaff C.L., Hiester K., Bonilla C., Sylvester N., Parrish-Gause D., Garvey W.T., Jin L. Ancestral proportions and admixture dynamics in geographically defined African Americans living in South Carolina. Am. J. Phys. Anthropol. 2001;114:18–29. - PubMed

Publication types

Substances