. 2015 Jan 21;137(2):675-84.
doi: 10.1021/ja511843w. Epub 2015 Jan 7.

Nano-gold corking and enzymatic uncorking of carbon nanotube cups

Affiliations

Nano-gold corking and enzymatic uncorking of carbon nanotube cups

Yong Zhao et al. J Am Chem Soc. .

Abstract

Because of their unique stacked, cup-shaped, hollow compartments, nitrogen-doped carbon nanotube cups (NCNCs) have promising potential as nanoscale containers. Individual NCNCs are isolated from their stacked structure through acid oxidation and subsequent probe-tip sonication. The NCNCs are then effectively corked with gold nanoparticles (GNPs) by sodium citrate reduction with chloroauric acid, forming graphitic nanocapsules with significant surface-enhanced Raman signature. Mechanistically, the growth of the GNP corks starts from the nucleation and welding of gold seeds on the open rims of NCNCs enriched with nitrogen functionalities, as confirmed by density functional theory calculations. A potent oxidizing enzyme of neutrophils, myeloperoxidase (MPO), can effectively open the corked NCNCs through GNP detachment, with subsequent complete enzymatic degradation of the graphitic shells. This controlled opening and degradation was further carried out in vitro with human neutrophils. Furthermore, the GNP-corked NCNCs were demonstrated to function as novel drug delivery carriers, capable of effective (i) delivery of paclitaxel to tumor-associated myeloid-derived suppressor cells (MDSC), (ii) MPO-regulated release, and (iii) blockade of MDSC immunosuppressive potential.


Figures

Figure 1
Figure 1
(a) Transmission electron microscopy (TEM) images of separated nitrogen-doped carbon nanotube cups (NCNCs). The upper right inset shows a magnified TEM image of an individual nanocup, and the lower left inset shows the length distribution of the separated cups. (b) Schematic illustration of corking NCNCs by (i) incubation with HAuCl4 and (ii) sodium citrate reduction. (c) Separated NCNCs functionalized with GNP corks by sodium citrate reduction. The inset shows the TEM image of an individual nanocup corked by a GNP on the opening. Some unbound GNPs are not completely removed upon single centrifugation. (d) High-resolution TEM image of the corked GNP/NCNC structure.
Figure 2
Figure 2
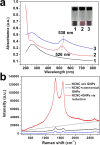
(a) UV–vis absorption spectra and photograph of aqueous suspensions of separated NCNCs (1), supernatant (2), and precipitate (3) of NCNC/GNP conjugates after centrifugation. (b) Raman spectra of separated NCNCs (black), NCNCs mixed with commercial GNPs (blue), and NCNCs corked with GNPs by in situ reduction process (red). The dotted line indicates the baseline.
Figure 3
Figure 3
TEM images of the growth process of GNPs on individual NCNCs sampled at (a) 5 min, (b) 20 min, (c) 50 min, and (d) 80 min after the addition of HAuCl4. Sodium citrate was added at 20 min right after the sampling. The arrows in (a) show the nucleation of gold seeds. Minimum energy reaction pathways for diffusion of Au20 cluster from the central region of the (7 × 11) graphene flake surface toward the zigzag edge (e) decorated with a CH2NH2 group and (f) when a second Au20 cluster is anchored to the −CH2NH2 group at the graphene edge. For both sets of pathways, the initial and final configurations are represented in the inset panels. Legend of atoms: C, green; N, blue; H, white; O, red; and Au, orange.
Figure 4
Figure 4
TEM images of the degradation process of NCNCs functionalized with GNPs under hMPO/H2O2/NaCl at (a) day 5, (b) day 10, and (c) day 20. (d) UV–vis spectra and (e) Raman spectra of the sample during degradation. The inset in (d) shows the red-shift of the GNP SPR band. (f) Intensity plots of the Raman G bands from the active sample (black), the NaCl control (red), and the H2O2 control (blue). The intensity was averaged and normalized to the initial value, and the error bars correspond to the standard errors of the mean.
Figure 5
Figure 5
(a) TEM image of the GNP/NCNC sample treated with neutrophils after 18 h of incubation. (b) Ratios of the NCNCs still corked with GNPs versus total NCNCs after the neutrophil treatment, with or without 18 h of incubation. The error bars correspond to the standard errors of the mean. (c,d) Optical image of the cell tissues from the GNP/NCNC sample treated with neutrophils: (c) before and (d) after 18 h of incubation, under Raman microscope. The insets show the Raman intensity mapping of G-band corresponding to the areas inside the dashed boxes.
Figure 6
Figure 6
(a) Raman spectra of free Rh123 drop-casted on a glass slide at the concentration of 15 μM (black), (1) the precipitate of NCNCs functionalized with GNPs in the presence of 0.15 μM Rh123, after repetitive wash, and (2) the precipitate of 0.15 μM Rh123 mixed with as-functionalized NCNC/GNP conjugates, after repetitive wash; the spectrum was taken at 10% laser intensity to weaken the NCNC background. (b) (1) The surface-enhanced Raman spectroscopy of GNP-corked NCNCs loaded with paclitaxel, (2) Raman spectrum of pure paclitaxel, scaled up by 5-fold, and (3) the control, in which GNP-corked NCNCs are added with paclitaxel, after repetitive centrifugal wash.
Figure 7
Figure 7
NCNC-delivered paclitaxel blocks immunosuppressive activity of tumor-associated MDSC. (a) Control and tumor-associated MDSC were incubated with empty and paclitaxel-loaded NCNC for 48 h, washed, counted, and coincubated with ConA preactivated and syngeneic splenic T lymphocytes. T cell proliferation was assessed by 3H-thymidine incorporation and expressed as count per minute (cpm) (*, p < 0.05, ANOVA). (b) Bone marrow MDSC were sorted from tumor-free mice and mice bearing B16 melanoma for 3 weeks, incubated with medium (control), empty NCNC, and NCNC/Pac. TGF-β was measured by ELISA in cell-free supernatants (*, p < 0.05 vs Cntr in tumor-free mice; **, p < 0.05 vs all groups).

References

    1. Matsumura Y.; Maeda H. Cancer Res. 1986, 46, 6387. - PubMed
    1. Allen T. M.; Cullis P. R. Science 2004, 303, 1818. - PubMed
    1. O’Neal D. P.; Hirsch L. R.; Halas N. J.; Payne J. D.; West J. L. Cancer Lett. 2004, 209, 171. - PubMed
    1. Maeda H. J. Controlled Release 2012, 164, 138. - PubMed
    1. Portney N. G.; Ozkan M. Anal. Bioanal. Chem. 2006, 384, 620. - PubMed

Publication types