. 2015 Mar 1:68:1-66.
doi: 10.1016/j.pmatsci.2014.10.002.

Advantages and Challenges of Relaxor-PbTiO3 Ferroelectric Crystals for Electroacoustic Transducers- A Review

Affiliations

Advantages and Challenges of Relaxor-PbTiO3 Ferroelectric Crystals for Electroacoustic Transducers- A Review

Shujun Zhang et al. Prog Mater Sci. .

Abstract

Relaxor-PbTiO3 (PT) based ferroelectric crystals with the perovskite structure have been investigated over the last few decades due to their ultrahigh piezoelectric coefficients (d33 > 1500 pC/N) and electromechanical coupling factors (k33 > 90%), far outperforming state-of-the-art ferroelectric polycrystalline Pb(Zr,Ti)O3 ceramics, and are at the forefront of advanced electroacoustic applications. In this review, the performance merits of relaxor-PT crystals in various electroacoustic devices are presented from a piezoelectric material viewpoint. Opportunities come from not only the ultrahigh properties, specifically coupling and piezoelectric coefficients, but through novel vibration modes and crystallographic/domain engineering. Figure of merits (FOMs) of crystals with various compositions and phases were established for various applications, including medical ultrasonic transducers, underwater transducers, acoustic sensors and tweezers. For each device application, recent developments in relaxor-PT ferroelectric crystals were surveyed and compared with state-of-the-art polycrystalline piezoelectrics, with an emphasis on their strong anisotropic features and crystallographic uniqueness, including engineered domain - property relationships. This review starts with an introduction on electroacoustic transducers and the history of piezoelectric materials. The development of the high performance relaxor-PT single crystals, with a focus on their uniqueness in transducer applications, is then discussed. In the third part, various FOMs of piezoelectric materials for a wide range of ultrasound applications, including diagnostic ultrasound, therapeutic ultrasound, underwater acoustic and passive sensors, tactile sensors and acoustic tweezers, are evaluated to provide a thorough understanding of the materials' behavior under operational conditions. Structure-property-performance relationships are then established. Finally, the impacts and challenges of relaxor-PT crystals are summarized to guide on-going and future research in the development of relaxor-PT crystals for the next generation electroacoustic transducers.

Keywords: Crystals; Electroacoustic; Ferroelectric; Piezoelectric; Relaxor-PT; Transducers.


Figures

Fig. 1
Fig. 1
General milestone map for piezoelectric transducer material development. KDP/ADP: KH2PO4/(NH4)H2PO4; BT: BaTiO3; LN: LiNbO3; PZT: Pb(Zr,Ti)O3; PN: PbNb2O6; PMN: Pb(Mg1/3Nb2/3)O3; PMN-PT: Pb(Mg1/3Nb2/3)O3-PbTiO3.
Fig. 2
Fig. 2
(a) Electromechanical coupling of relaxor-PT crystals as a function of Curie temperature; (b) Piezoelectric coefficient of relaxor-PT crystals as a function of TRT. BSPT: BiScO3-PbTiO3; PYNT: Pb(Yb0.5Nb0.5)O3-PbTiO3. (Reprinted with permission from S. J. Zhang and T. R. Shrout, IEEE Transactions on Ultrasonics Ferroelectrectrics Frequency Control 57, 2138 (2010). Copyright© 2010, IEEE) [318]
Fig. 3
Fig. 3
Coercive field as a function of Curie temperature for perovskite relaxor-PT crystals. (Reprinted with permission from S. J. Zhang and T. R. Shrout, IEEE Transactions on Ultrasonics Ferroelectrectrics Frequency Control 57, 2138 (2010). Copyright© 2010, IEEE) [318].
Fig. 4
Fig. 4
As grown relaxor-PT crystal (middle), domain observation under polarized light for unpoled crystal wafer with R, O and T phases (left), where there is no clear domain wall observed in R crystals, while cloudy and clear domain walls being observed in O and T crystals, respectively. The relevant macroscopic symmetries when poled along different crystallographic directions and the desirable properties corresponding to different domain configurations are listed in the figure (right).
Fig. 5
Fig. 5
Orientation dependence of the piezoelectric coefficient (left) d33* and (right) d32* for single domain PIN-PMN-PT crystals. For plotting the figures, the X axis is fixed along [11̄0] direction, the Z and Y axis are rotated around X axis. It can be seen from figure (a) and (b) that the maximum piezoelectric coefficients of rhombohedral PIN-PMM-PT crystal are not presented in the standard coordinate system of 3m point group (X, Y, and Z axis are along [11̄0], [11̄2] and [111] direction, respectively). For d33*, the maximum value is observed when the Z’ axis is rotated to [001] direction. For d32*, the maximum value is presented in the coordinate system with Z’ and Y’ axis being along [110] and [001̄] directions, respectively.
Fig. 6
Fig. 6
The orientation dependence of the spontaneous polarization P3*, dielectric permittivity ε33*, electrostrictive coefficient Q33* and piezoelectric coefficient d33* for tetragonal PIN-PMN-PT crystals. Based on the equation dPεQ, the orientation dependence of d33* is determined by orientation dependence of spontaneous polarization P3*, dielectric permittivity ε33 and electrostrictive coefficient Q33*. To obtain the coefficient value (Q33*, d33*, or ε33*) of one direction, a line along this direction should be plotted from the origin to surface of 3D figure. An intersection point can be found between the line and surface of 3D figure. The distance between this intersection point and the origin indicates the coefficient value along the direction of this line. (input data from ref. [293])
Fig. 7
Fig. 7
The level of extrinsic contribution to piezoelectric response at 1kV/cm for (a) (1-x)PMN-xPT crystals with various compositions [Reprinted with permission from F. Li et al., Journal of Applied Physics 108, 034106 (2010). Copyright © 2010, the American Institute of Physics.]; (b) PIN-PMN-PT crystals, where the increase of TC represents the PT content increasing in PIN-PMN-PT crystals. Reprinted with permission from F. Li et al., Journal of Applied Physics 109, 014108 (2011). Copyright © 2011, the American Institute of Physics.
Fig. 8
Fig. 8
(a) The temperature dependent Rayleigh parameters, (b) Variation of d33 as a function of temperature for [001] poled PIN-PMN-PT crystals and PMN-PT ceramics. (data from ref. [363])
Fig. 9
Fig. 9
Temperature dependence of d33 and K33Pr; (b) Temperature dependence of k33 and s33E for PMN-0.28PT crystals. (Reprinted with permission from F. Martin et al., Journal of Applied Physics 111, 104108 (2012). Copyright © 2012, the American Institute of Physics. [365]
Fig. 10
Fig. 10
(a) Strain versus electric field curves for PMN-0.29PT crystals measured along [001] and [111] directions at room temperature. (b) Schematic illustration of the domain switching for rhombohedral crystal. (b) [111] oriented crystal. At the coercive, which is antiparallel to the [111] direction, [111] domain could transform to the [1̄11], [11̄1], [1̄1̄1], [111̄], [1̄11̄], and [11̄1] domains, (c) [001] oriented crystal. At the coercive, which is antiparallel to the [001] direction, [111], [1̄11], [11̄1] and [1̄1̄1] domains transform to the [111̄], [1̄11̄], [11̄1̄], and [1̄1̄1̄] domains). Reprinted with permission from L. Jin et al. Journal of the American Ceramics Society 97, 1 (2014) Copyright © 2014, The American Ceramic Society. [42]
Fig. 11
Fig. 11
(a) Schematic figure of thickness shear piezoelectric deformation, (b) Schematic figure of face shear piezoelectric deformation. P is the poling direction. It should be noted that the resonance frequency is controlled by the thickness of the piezoelectric element in thickness shear deformation, while it is controlled by the edge length of the element in face shear deformation. Reprinted with permission S.J. Zhang et al. IEEE Transactions on Ultrasonics Ferroelectrectrics Frequency Control 60, 1572 (2013) Copyright © 2013, IEEE. [374]
Fig. 12
Fig. 12
Schematic view of the medical imaging system and the operational mechanism. The equations are from references [3,385]. k: coupling; ε33S: clamped dielectric, c33D: elastic stiffness, ρ: density, v: sound velocity, R: electrical impedance, C: capacitance, Z: acoustic impedance.
Fig. 13
Fig. 13
The comparison of various vibration modes of relaxor-PT crystals and their corresponding electromechanical coupling values.
Fig. 14
Fig. 14
Medical imaging transducer operational frequency and the corresponding imaging human tissues. The equations are from [391]. C: capacitance; A: sample area; t: sample thickness; fa: antiresonance frequency; cD: elastic stiffness; v: sound velocity; λ: wavelength; f: frequency.
Fig. 15
Fig. 15
Electromechanical coupling factor for monolithic and crystal/epoxy 1–3 composites as a function of sample thickness and corresponding ultrasound frequency. Reprinted with permission from H. J. Lee et al., Journal of Applied Physics 107, 124107 (2010). Copyright © 2010, the American Institute of Physics. [405]
Fig. 16
Fig. 16
Left: Unipolar strain as a function of electric field for room temperature poled (a) and field cooling poled (b) [001] oriented PMN-PT crystals (with thickness of 100 µm); Right: the unipolar strain behavior after pulse tests (a) 3 kV/cm, 7 × 10⁵ cycles, (b) 3 kV/cm, 7 × 10⁷ cycles, (c) 6 kV/cm, 7 × 10⁵ cycles, (d) 6 kV/cm, 1.5 × 10⁶ cycles. Reprinted with permission from D. B. Lin et al. Scripta Materialia 64, 1149 (2011), Copyright © 2011, Acta Materialia Inc. [198]
Fig. 17
Fig. 17
The basic principles of HIFU producing tissue necrosis (a), Operational mechanism for drug delivery using ultrasound waves (b).
Fig. 18
Fig. 18
Langevin transducer with a horn for medical surgery applications. Equations are from [3,10,388]. Pdisp: dissipated power; ω: angular frequency; Yr: Young’s modulus; S: strain; Qm: mechanical quality factor; k: electromechanical coupling; d: piezoelectric coefficient; v0: vibration velocity at the horn tip; P: acoustic power; ε: dielectric permittivity; E: electric field.
Fig. 19
Fig. 19
The relationship between mechanical Qm and electromechanical coupling factor for different polycrystalline and single crystal systems. Reprinted with permission from S. J. Zhang and T. R. Shrout, IEEE Transactions on Ultrasonics Ferroelectrectrics Frequency Control 57, 2138 (2010). Copyright© 2010, IEEE [318]
Fig. 20
Fig. 20
Schematic figure for underwater electroacoustic transducer applications, locating a large school of fish. Equations are from [3]. Rr: radiation resistance; R: internal mechanical resistance; v0: vibration velocity at transducer surface; ηea: electroacoustic efficiency; keff: electromechanical coupling; Qm: mechanical quality factor; s: elastic compliance; c: elastic stiffness; ρ: density; N: frequency constant; V: voltage; d: piezoelectric coefficient.
Fig. 21
Fig. 21
(a) Mechanical loss factor (inverse of mechanical Qm) of various relaxor-PT crystals as a function of drive field at resonance frequency. Reprinted with permission from S. J. Zhang and F. Li, Journal of Applied Physics 111, 031301 (2012). Copyright © 2012, the American Institute of Physics. [141] (b) Dielectric loss of various relaxor-PT crystals as a function of drive field at 1Hz. Reprinted with permission from N. Sherlock, L. Garten, S. Zhang, T. Shrout and R. Meyer, Journal of Applied Physics 112, 124108 (2012). Copyright © 2012, the American Institute of Physics. [429].
Fig. 22
Fig. 22
Schematic figures of acoustic transducers with various geometries. The piezoelectric elements with different vibration mechanisms used in these transducers are given at the bottom, P: poling direction; ■: Electrodes on piezoelectric elements. (Figures adapted from ref. [10, 376])
Fig. 23
Fig. 23
Schematic of hydrophone operational mechanism. Equations are from [3,10]. Pdisp: dissipated power; tanδ: dielectric loss; ω: angular frequency; E: electric field; ε: dielectric constant; dh: hydrostatic piezoelectric charge coefficient; gh: hydrostatic piezoelectric voltage coefficient;V0: volume of the sensing material.
Fig. 24
Fig. 24
Schematic diagram of 2-2 crystal/epoxy composite comprised of [011] poled relaxor-PT single crystals, with layers parallel to X axis. (Figure adapted from ref. [99])
Fig. 25
Fig. 25
(a) Temperature dependent shear piezoelectric coefficients for PIN-PMN-PT crystals with “1O” single domain state (data from [–340]), (b) Temperature dependent longitudinal piezoelectric coefficient for PIN-PMN-PT crystals with “3O” engineered domain configuration (data from [141]).
Fig. 26
Fig. 26
Two independent shear piezoelectric responses (15- and 24-mode) and related polarization rotation path in orthorhombic crystals, where the solid and dotted blue arrows represent the polarization rotation process under perpendicular electric field. The coordinate system of orthorhombic crystal is presented on the left. The principal axis of orthorhombic phase are notated as [001]O, [010]O and [100]O, being equal to [011]C, [0–11]C and [100]C cubic axis, respectively (adapted from [339]). The related phase diagram exhibiting strongly curved O-T MPB and vertical R-O MPB were given at the bottom of the figure.
Fig. 27
Fig. 27
Strain electric field loops for PIN-PMN-PT:Mn (a) as a function of applied compressive prestress, (b) measured at 10MPa prestress and as a function of dc bias. (data from [452])
Fig. 28
Fig. 28
Schematic of domain variation for [001] poled rhombohedral relaxor-PT crystal under uniaxial stress. (a) original state for [001] poled rhombohedral relaxor-PT crystal, where the solid arrows represent the possible domain directions. (b) under a moderate uniaxial stress. (c) and (d) show the two possible conditions of domain variation under a strong stress. For (c), the rhombohedral domains are transformed to orthorhombic domains by applying a stress. For condition (d), rhombohedral crystal is depolarized by the stress, where the blue arrows represent the new domain directions.
Fig. 29
Fig. 29
(a) Bipolar strain behavior for PIN-PMN-PT:Mn crystals under various prestress levels (small inset shows strain behavior of pure PIN-PMN-PT for comparison), (b) Piezoelectric coefficient d32 as a function of prestress for PIN-PMN-PT:Mn and compared to its pure counterparts Reprinted with permission from S. J. Zhang et al., Applied Physics Letters 102, 172902 (2013). Copyright © 2013, the American Institute of Physics [453].
Fig. 30
Fig. 30
Polarization rotation for [011] poled crystals under applied transverse compressive stress σ2 and electric field E3. Reprinted with permission from S. J. Zhang et al., Applied Physics Letters 102, 172902 (2013). Copyright © 2013, the American Institute of Physics [453].
Fig. 31
Fig. 31
P-E loops at various uniaxial compressive stress for PIN-PMN-PT crystals with “1T” (a) and “2R” (b) domain states (measured at 1Hz). Reprinted with permission from F. Li et al., Applied Physics Letters 100, 192901 (2012). Copyright © 2012, the American Institute of Physics. [451].
Fig. 32
Fig. 32
Schematic of polar vectors for (a) [001] poled tetragonal crystal and (b) [011] poled rhombohedral crystal under perpendicular uniaxial stress. (Figures adapted from ref. [451])
Fig. 33
Fig. 33
Piezoelectric coefficient matrix and cross-talk of piezoelectric 15- and 16-mode in 1R relaxor-PT crystals. The arrows represent the polarization of 1R relaxor-PT crystal. The coordinate systems for piezoelectric coefficient matrix and the shear sample are given on right.
Fig. 34
Fig. 34
Schematic of Ztθ cut sample (a) and ZXlt θ/ψ cut sample (b).
Fig. 35
Fig. 35
The design of 24-mode sensor by using 1R relaxor-PT crystal. In this figure, the blue arrows represent the polarization of 1R crystal. By this design, the cross-talks from d21 and d22 piezoelectric effects can be eliminated. (Figures adapted from ref. [466])
Fig. 36
Fig. 36
Schematic of tactile sensing techniques.
Fig. 37
Fig. 37
Measured electrical impedance at the resonant frequency; impedance change in relation to (a) material properties of sensing layer and (b) applied force. Reprinted with permission from K. Kim et al., Applied Physics Letters 100, 253501 (2012). Copyright © 2012, the American Institute of Physics. [379].
Fig. 38
Fig. 38
(a) Sensor array with an applied water drop; (b) Mapped image for water drop. Reprinted with permission from K. Kim et al., IEEE IUS 2012, 1059 (2012). Copyright © 2012, IEEE. [378].
Fig. 39
Fig. 39
Schematic of acoustic tweezers.
Fig. 40
Fig. 40
Design cross section of a self-focused needle transducer. Reprinted with permission from H. Hsu et al., Applied Physics Letters 101, 024105 (2012). Copyright © 2012, the American Institute of Physics. [512].
Fig. 41
Fig. 41
(a) Schematic and (b) photograph of the microfluidic device for ultrasonic trapping of microparticles. Reprinted with permission from S. Guo et al., Applied Physics Letters 92, 213901 (2008). Copyright © 2008, the American Institute of Physics. [508].
Fig. 42
Fig. 42
Vibration amplitude properties of FS-2 and FS-3 modes, (a) and (c) measured displacement amplitudes (colored contours) and simulated deformation shapes (red contours), corresponding to T/4 and 3 T/4 cycle, (b) and (d) measured motion trajectories of the Corners (A) and (B). Reprinted with permission from P. H. Ci et al., Applied Physics Letters 104, 242911 (2014). Copyright © 2014, the American Institute of Physics [382]
Fig. 43
Fig. 43
Schematic drawings of piezoelectric single-crystal PIN-PMN-PT L1-B2 double-mode micro-motor. Reprinted with permission from T. Hemsel and J. Wallaschek, Ultrasonics 38, 37–40 (2000). Copyright © Elsevier B.V. (2000) [522].
Fig. 44
Fig. 44
Wobbling mode piezomotor. Left: schematic view of a wobbling motor; Middle: photograph of an assembled stator with two single crystal stacks; Right: assembled single crystal linear motor. Reprinted with permission from S. X. Dong et al., Applied Physics Letters 86, 053501 (2005). Copyright © 2005, the American Institute of Physics [359]
Fig. 45
Fig. 45
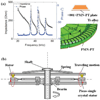
PMN-PT single crystal/Ti-alloy 9λ traveling wave motor: (a) PMN-PT/Ti-alloy stator and its impedance spectrum; and (b) motor configuration. Reprinted with permission from S. X. Dong et al., Applied Physics Letters 92, 153504 (2008). Copyright © 2008, the American Institute of Physics [366]

References

    1. Carlin B. Ultrasonics. New York: McGraw-Hill; 1960.
    1. Ensminger D, Bond LJ. Ultrasonics: Fundamentals, Technologies, and Applications. New York: CRC Press; 2011.
    1. Sherman CH, Butler JL. Transducers and Arrays for underwater sound. New York: Springer; 2007.
    1. Narouze SN. Atlas of ultrasound- guided procedures in interventional pain management. New York: Springer; 2010. - PubMed
    1. Cheeke JDN. Fundamentals and applications of ultrasonic waves. New York: CRC Press; 2012.