. 2014 Dec 22:3:e03487.
doi: 10.7554/eLife.03487.

A novel N-terminal extension in mitochondrial TRAP1 serves as a thermal regulator of chaperone activity

Affiliations

A novel N-terminal extension in mitochondrial TRAP1 serves as a thermal regulator of chaperone activity

James R Partridge et al. Elife. .

Abstract

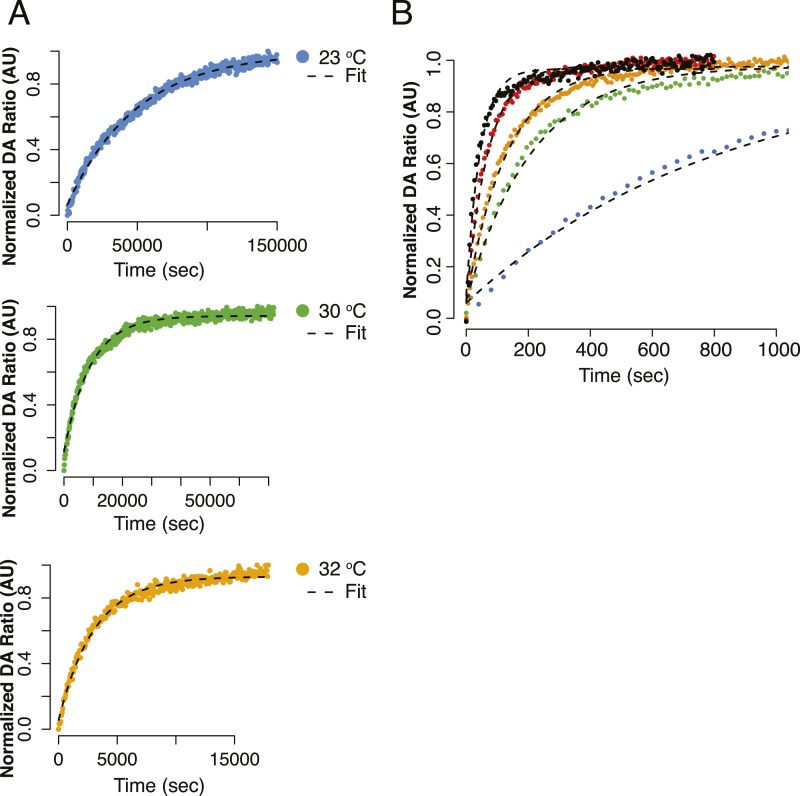
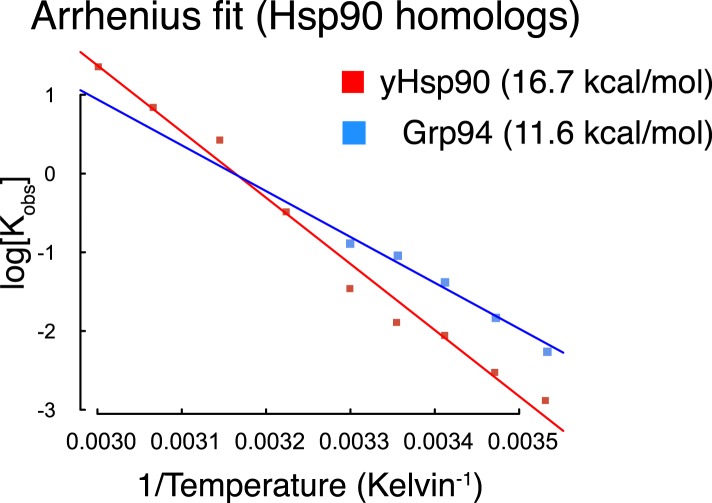
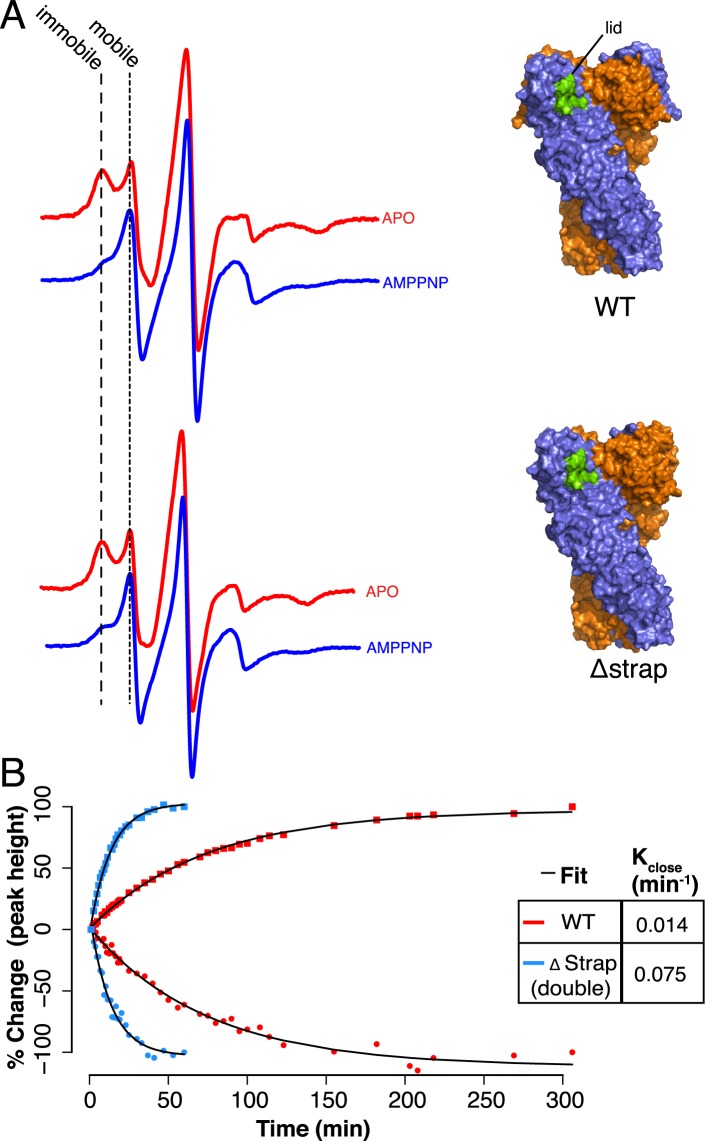
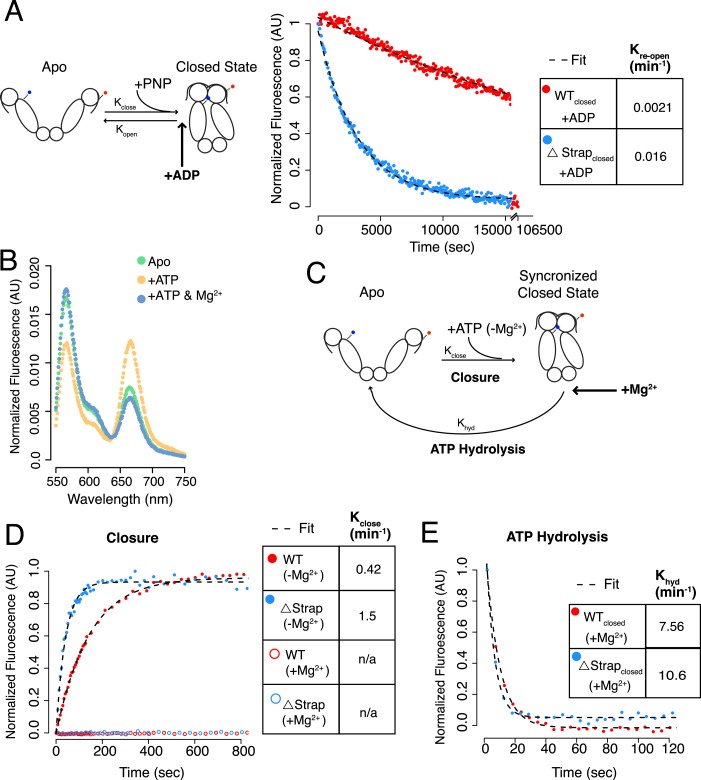
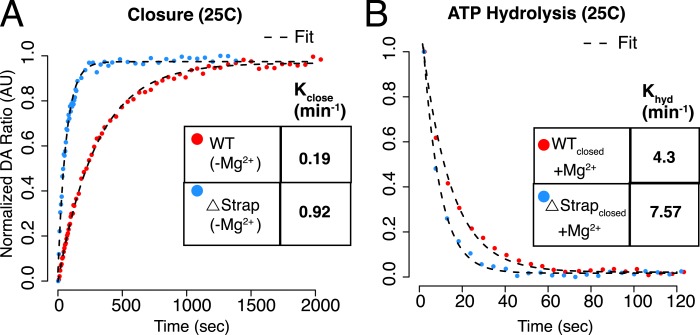
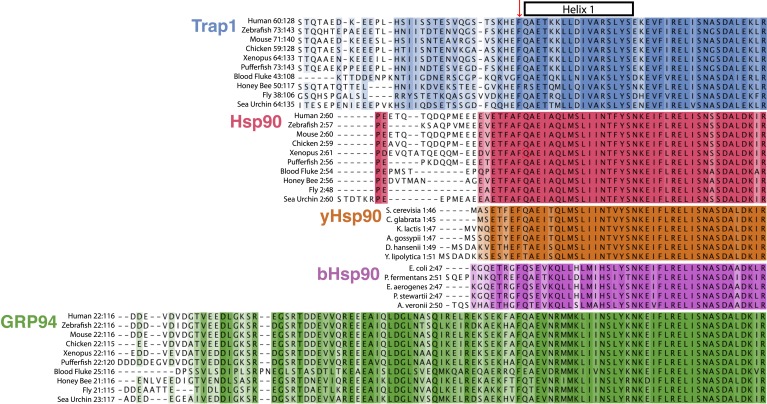
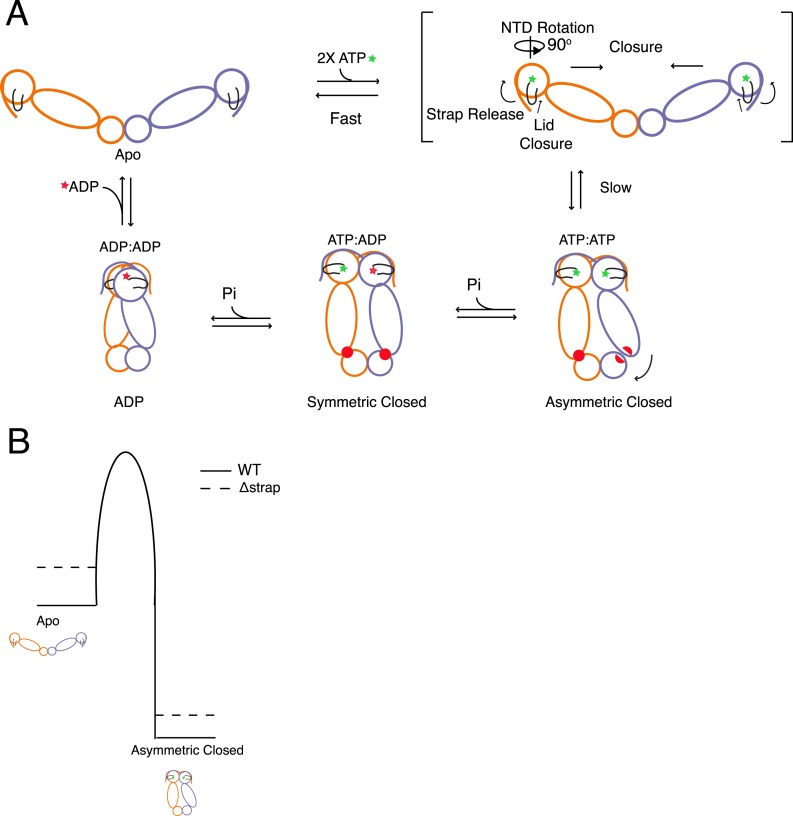
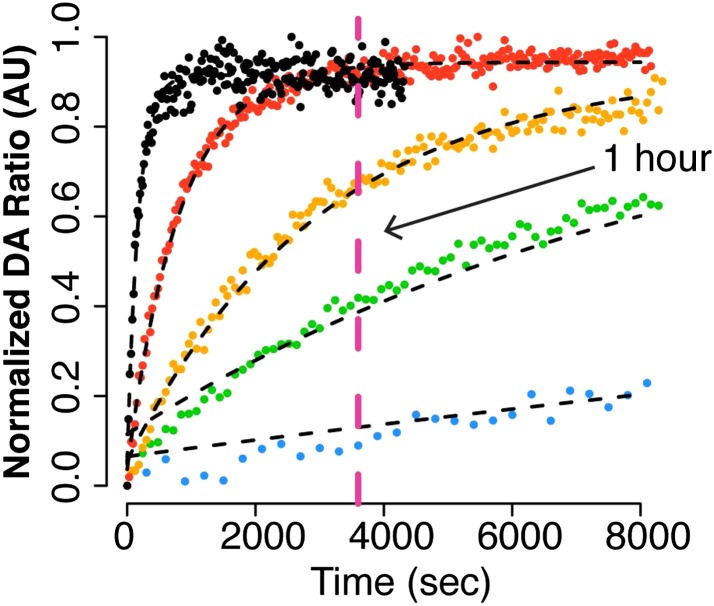
Hsp90 is a conserved chaperone that facilitates protein homeostasis. Our crystal structure of the mitochondrial Hsp90, TRAP1, revealed an extension of the N-terminal β-strand previously shown to cross between protomers in the closed state. In this study, we address the regulatory function of this extension or 'strap' and demonstrate its responsibility for an unusual temperature dependence in ATPase rates. This dependence is a consequence of a thermally sensitive kinetic barrier between the apo 'open' and ATP-bound 'closed' conformations. The strap stabilizes the closed state through trans-protomer interactions. Displacement of cis-protomer contacts from the apo state is rate-limiting for closure and ATP hydrolysis. Strap release is coupled to rotation of the N-terminal domain and dynamics of the nucleotide binding pocket lid. The strap is conserved in higher eukaryotes but absent from yeast and prokaryotes suggesting its role as a thermal and kinetic regulator, adapting Hsp90s to the demands of unique cellular and organismal environments.

Keywords: ATPase; E. coli; Hsp90; SAXS; Trap1; biochemistry; biophysics; chaperone; mitochondria; structural biology.


Conflict of interest statement

The authors declare that no competing interests exist.

Figures

Figure 1.
Figure 1.. A temperature-dependent barrier separates the apo and closed state of TRAP1.
(A) Negative stain electron microscopy (EM) images of hTRAP1 in the presence of AMPPNP at increasing temperatures for 1 hr. While the population at equilibrium appears to remain in an apo conformation at room temperature (RT), conversion to the closed state appears to be intermediate at 30°C and nearly complete at 37°C and 42°C. (B) Negative stain EM images of reactions incubated at 23°C and 37°C from A after returning the sample to RT and incubating overnight. Both populations remain apo and closed (respectively) demonstrating the large kinetic barrier that limits the conformational transition from apo to the closed state. Scale bar is 100 nm. DOI: http://dx.doi.org/10.7554/eLife.03487.004
Figure 2.
Figure 2.. A large energy barrier to the closed state is modulated by the NTD-strap.
(A) SAXS distributions at equilibrium for hTRAP1 (left) and zTRAP1 (right) (84% identical to hTRAP1) in apo and in the presence of saturating AMPPNP at indicated temperatures for 1 hr. The closed-state population substantially increases at and above 36°C for hTRAP1 while zTRAP1 maintains a higher level of % closed at even lower temperatures, consistent with the differences in physiological temperatures of the two species. (B) SAXS distributions of Δstrap in matching conditions from A showing that removal of the strap mitigates the temperature-dependent barrier between the apo and closed states. (C) Quantification of percent closed for both TRAP1 species ± the strap region. Apparent is the different temperature dependence of hTRAP1 and zTRAP1 and the loss of temperature response of the chaperone in the case of Δstrap. (D) A plot of percent closed state verses temperature of WT hTRAP1 (left) and Δstrap hTRAP1 after closure has completed at each given temperature (solid bars as in (C). These samples were then cooled for 2 hr at 20°C (stripped bars). The data suggest a highly stable closed state. DOI: http://dx.doi.org/10.7554/eLife.03487.005
Figure 3.
Figure 3.. NTD-strap regulates ATP hydrolysis rates.
WT and strap mutants for hTRAP1. Removal of the strap (Δstrap) results in a ∼30-fold increase in ATPase rate, while truncations before the previously reported salt bridge contact Δ60–69 (Lavery et al., 2014) show no change in activity. Average steady-state hydrolysis rates (min−1) above each bar, standard deviation of triplicate measurements can be found in Table 2. DOI: http://dx.doi.org/10.7554/eLife.03487.008
Figure 4.
Figure 4.. The NTD-strap regulates closure rate of TRAP1.
(A) Steady-state FRET scans at 23°C for apo and AMPPNP reactions after closure with AMPPNP reached completion illustrating the anti-correlated change in FRET upon closure as measured by ‘dimer closure’ between protomers (left, Inter FRET) and rotation of the NTD from apo to the closed state within one protomer ‘NTD:MD Rotation’ (right, Intra FRET). (B) Temperature-dependent closure rates for WT hTRAP1 measured by both the dimer closure and NTD rotation FRET probes from A. Closure rates are comparable between these two sets of FRET probes as indicated in the table to the right. The predicted increase in rate at higher temperatures is apparent. (C) Closure at 30°C of WT compared to heterodimers lacking one or both NTD strap residues measured by dimer closure FRET (left) and NTD rotation FRET (right). Closure rates are found in the table for each experiment. (D) Temperature-dependent closure rates of Δstrap protein measured using the dimer closure probes from A (Inter FRET) illustrating both a rate acceleration and a dramatic loss of temperature dependence compared to WT (B, left panel). (E) Arrhenius plot of WT and Δstrap plotted using data from panels (B) (left) and (D). From the difference in activation energies Ea between WT and Δstrap, the strap contributes approximately 60% of the measured Ea for WT hTRAP1 (48.8 kcal/mol Ea for WT; 29 kcal/mol Δstrap). These data are consistent with the steady-state SAXS and ATPase and show that removal of the strap region lowers the energy barrier between apo and the closed state. DOI: http://dx.doi.org/10.7554/eLife.03487.009
Figure 4—figure supplement 1.
Figure 4—figure supplement 1.. Alternative view of curve fits for Figure 4B,D.
(A) Kinetics of FRET closure at lower temperatures (23°C, 30°C, 32°C) with fits shown for full measured curve. All reactions were taken to completion. (B) Data from Figure 4D plotted to focus on the smaller difference in closure rate for Δstrap at increasing temperatures. DOI: http://dx.doi.org/10.7554/eLife.03487.010
Figure 4—figure supplement 2.
Figure 4—figure supplement 2.. Arrhenius plots for Hsp90 homologs plotted using data from reference (Frey et al., 2007).
Calculated Ea for each homolog is listed in figure legend parentheses. DOI: http://dx.doi.org/10.7554/eLife.03487.011
Figure 5.
Figure 5.. Lid Closure rate is regulated by the NTD-strap.
(A) Continuous Wave (CW) EPR scans of cysteine Free WT (top) and Δstrap zTRAP1 (bottom) labeled with a spin-probe on the NTD-lid (green) in order to observe changes to the lid in the apo and closed states (‘Materials and methods’). In the apo state the lid probe shows signal for both mobile and immobile states, although crystallographic data indicate that even in the mobile state, the majority of the lid is still reasonably well ordered. After addition of AMPPNP, the observed signal shifts indicating a predominantly mobile state of the lid, which corresponds to changes in lid dynamics that accompany NTD rotation and dimerization. Only subtle differences are seen in the mobile:immobile peak ratio upon strap deletion. (B) CW-EPR scans at ∼23°C taken for the cysteine-free WT (red) and Δstrap zTRAP1 (blue) over time after addition of AMPPNP. The percent change in peak height (final vs start) over time is plotted for both the immobile (squares) and mobile (circles) components, showing a clear anti-correlation. The mobile and immobile populations were jointly fit with a single exponential process (‘Materials and methods’) having a rate constant of 0.014 min−1 for WT and 0.075 min−1 for Δstrap, demonstrating a strong coupling between the strap and the NTD-lid. DOI: http://dx.doi.org/10.7554/eLife.03487.015
Figure 6.
Figure 6.. The NTD-strap plays a smaller role in additional steps of the ATPase cycle.
(A) Schematic of dimer closure and re-opening upon addition of AMPPNP (PNP) using the dimer closure FRET probe (left). Re-opening of WT hTRAP1 and Δstrap was induced by 20-fold excess ADP after closure with AMPPNP. Re-opening was accelerated by ∼eightfold upon removal of the strap as determined by the ratio of the rates (table inset). (B) Steady-state FRET scans of dimer closure FRET in apo and plus ATP in the absence of Mg2+. Without Mg2+ a closed state accumulates, whereas subsequent addition of Mg2+ (‘+ATP & Mg2+’) allows hydrolysis to proceed thereby shifting the population to the apo state. (C) Schematic of a kinetic experiment using the Mg2+ dependence to separate the rate of hydrolysis from rate of closure. By omitting Mg2+, the population can be synchronized in a closed state that is unable to hydrolyze ATP. Subsequent rapid addition of Mg2+ leads to ATP hydrolysis, which has now been decoupled from the closure step. (D) Kinetic experiments measuring closure and (E) ATP hydrolysis. No closed state accumulates if Mg2+ is included in the closure reaction. Again we observe that removal of strap residues leads to an accelerated closure rate, whereas the difference in ATP hydrolysis is small. Kinetic rates for each are listed in the table insets. DOI: http://dx.doi.org/10.7554/eLife.03487.016
Figure 6—figure supplement 1.
Figure 6—figure supplement 1.. ATP Hydrolysis at 25°C.
(AB) Kinetic experiment designed to decouple ATP hydrolysis from the preceding closure step at 25°C outlined in Figure 6C–E. The measured rates for WT agree well with previous single turnover measurements (Leskovar et al., 2008), however, we find that decoupling the closure rate from hydrolysis results in a reassignment of the previous rates with closure being the slowest step. Kinetic rates for each are listed in the table inset. DOI: http://dx.doi.org/10.7554/eLife.03487.017
Figure 7.
Figure 7.. Evolution of Hsp90 NTD-strap sequences.
Alignments were generated individually for each Hsp90 isoform using a conserved portion of the N-terminal domain and the NTD-strap region. The variable signal sequences for TRAP1 and Grp94 were removed before aligning the 10 divergent sequences. Helix one (H1) of the NTD is annotated above the alignments and begins just after the strictly conserved Phe residue that structurally appears to separate the β-strand region of the NTD from H1. This alignment clearly shows the divergence of both length and sequence within the NTD-strap region and also reveals that residues are more conserved amongst Hsp90 isoforms within H1 and the region following H1. TRAP1 has a much longer strap region than cytosolic Hsp90 and conservation does not pick up until the structural region, as made evident in the TRAP1 crystal structure (Lavery et al., 2014). Both yHsp90 and bHsp90 lack a significant strap sequence and Grp94 clearly has an extended and well-conserved strap region. DOI: http://dx.doi.org/10.7554/eLife.03487.018
Figure 8.
Figure 8.. Model for the conformational cycle and unique energy landscape of TRAP1.
(A) In the absence of nucleotide the chaperone is in equilibrium between various open conformations (for simplicity we only show the most open) with the strap folded back onto the cis protomer. Upon binding of ATP, conformational changes necessary for the transition to the closed state are initiated. Here, we propose that the cis contacts of the strap are broken allowing the lid and NTD to undergo conformational changes towards the closed state. After the slow closure step the chaperone assumes the previously reported asymmetric conformation (Lavery et al., 2014). Sequential hydrolysis leads to changes in symmetry rearranging the unique MD:CTD interfaces and client binding residues (red) before sampling the ADP conformation and resetting the cycle to the apo state equilibrium. (B) Model for the unique energy landscape of TRAP1. Solid lines illustrate the energy landscape of WT TRAP1, and the dashed lines depict the change in landscape upon the loss of the extended N-terminal strap sequence in TRAP1. By stabilizing both the apo and closed states, the strap increases the effective height of the energy barrier. This modulates the conformational landscape, and in the case of hTRAP1 provides pronounced temperature sensitivity. DOI: http://dx.doi.org/10.7554/eLife.03487.019
Author response image 1.
Adapted from Figure 4B (Intra FRET probe data set).

References

    1. Ali MM, Roe SM, Vaughan CK, Meyer P, Panaretou B, Piper PW, Prodromou C, Pearl LH. Crystal structure of an Hsp90-nucleotide-p23/Sba1 closed chaperone complex. Nature. 2006;440:1013–1017. doi: 10.1038/nature04716. - DOI - PMC - PubMed
    1. Chen B, Zhong D, Monteiro A. Comparative genomics and evolution of the HSP90 family of genes across all kingdoms of organisms. BMC Genomics. 2006;7:156. doi: 10.1186/1471-2164-7-156. - DOI - PMC - PubMed
    1. Cunningham CN, Southworth DR, Krukenberg KA, Agard DA. The conserved arginine 380 of Hsp90 is not a catalytic residue, but stabilizes the closed conformation required for ATP hydrolysis. Protein Science. 2012;21:1162–1171. doi: 10.1002/pro.2103. - DOI - PMC - PubMed
    1. Dollins DE, Warren JJ, Immormino RM, Gewirth DT. Structures of GRP94-nucleotide complexes reveal mechanistic differences between the hsp90 chaperones. Molecular Cell. 2007;28:41–56. doi: 10.1016/j.molcel.2007.08.024. - DOI - PMC - PubMed
    1. Echeverria PC, Bernthaler A, Dupuis P, Mayer B, Picard D. An interaction network predicted from public data as a discovery tool: application to the Hsp90 molecular chaperone machine. PLOS ONE. 2011;6:e26044. doi: 10.1371/journal.pone.0026044. - DOI - PMC - PubMed

Publication types

Substances