. 2015 Sep 17;34(38):4964-74.
doi: 10.1038/onc.2014.420. Epub 2014 Dec 22.

PAX3 and ETS1 synergistically activate MET expression in melanoma cells

Affiliations

PAX3 and ETS1 synergistically activate MET expression in melanoma cells

J D Kubic et al. Oncogene. .

Abstract

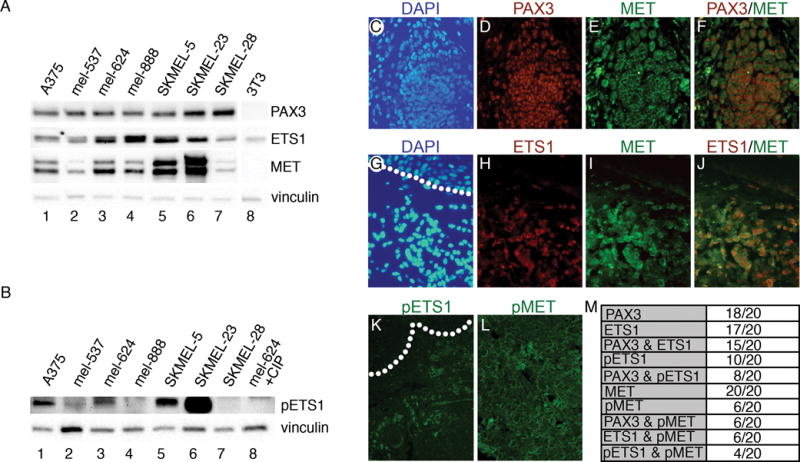
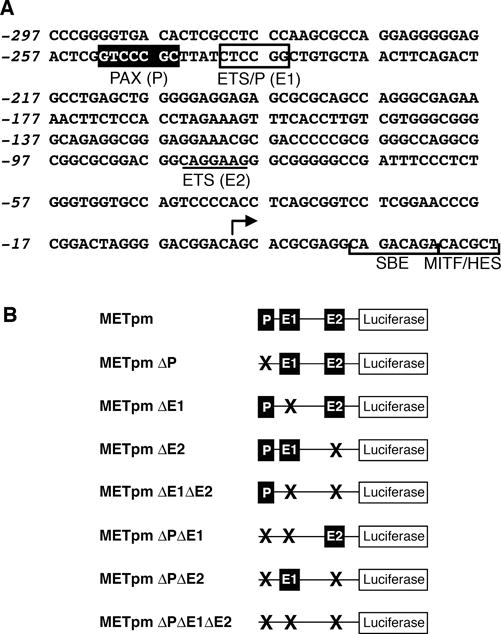
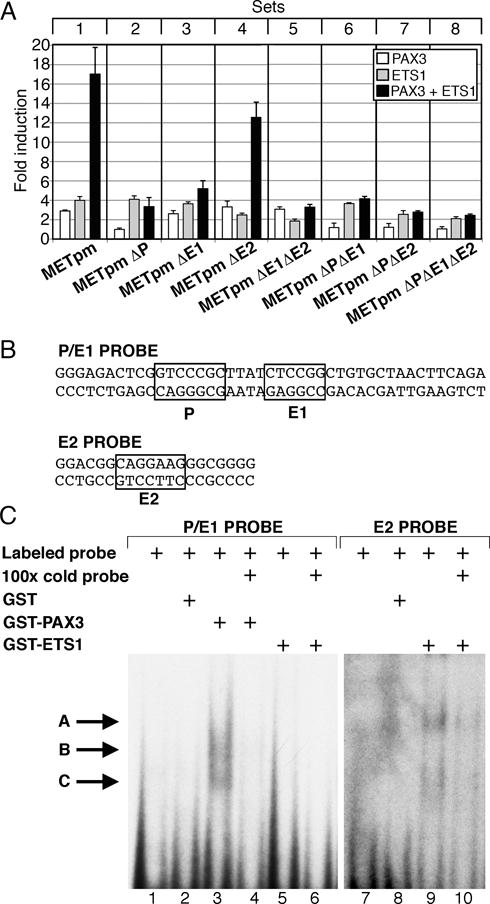
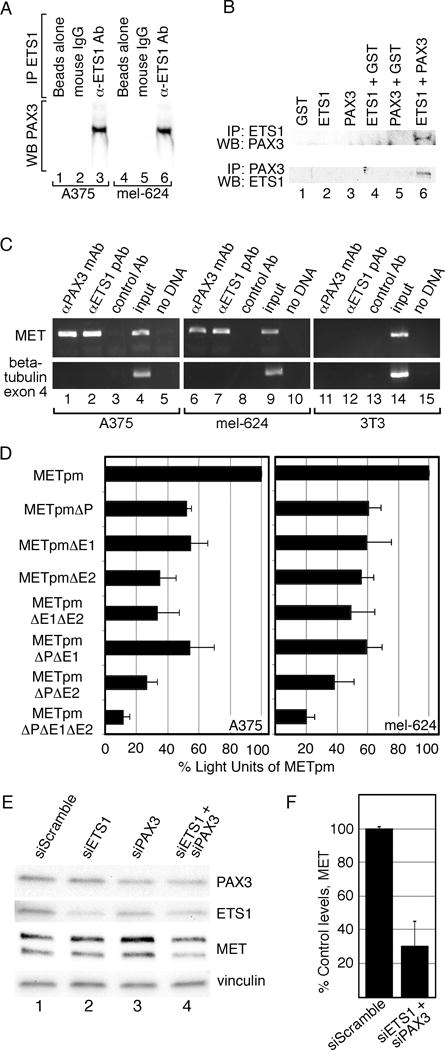
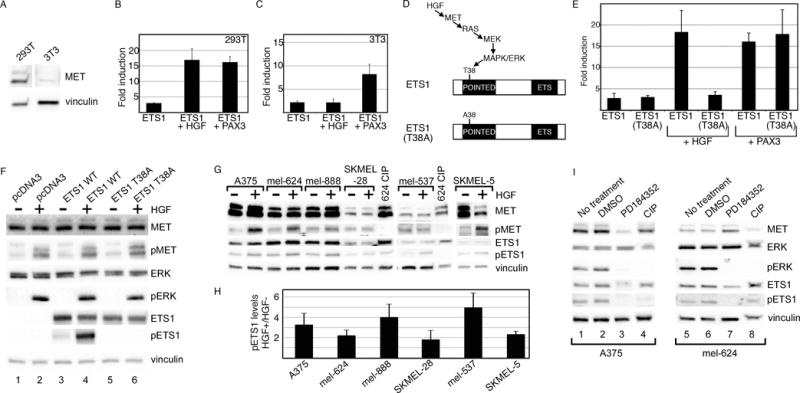
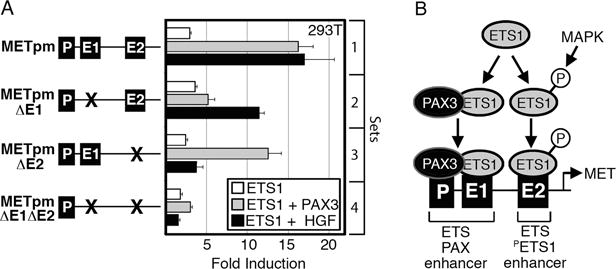
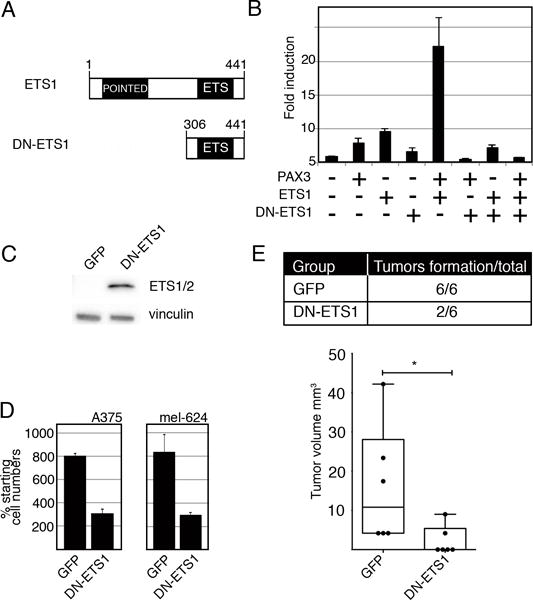
Melanoma is a highly aggressive disease that is difficult to treat owing to rapid tumor growth, apoptotic resistance and high metastatic potential. The MET proto-oncogene (MET) tyrosine kinase receptor promotes many of these cellular processes, but while MET is often overexpressed in melanoma, the mechanism driving this overexpression is unknown. As the MET gene is rarely mutated or amplified in melanoma, MET overexpression may be driven to increased activation through promoter elements. In this report, we find that transcription factors PAX3 and ETS1 directly interact to synergistically activate MET expression. Inhibition of PAX3 and ETS1 expression in melanoma cells leads to a significant reduction of MET receptor levels. The 300-bp 5' proximal MET promoter contains a PAX3 response element and two ETS1 consensus motifs. Although ETS1 can moderately activate both of these sites without cofactors, robust MET promoter activation of the first site is PAX dependent and requires the presence of PAX3, whereas the second site is PAX independent. The induction of MET by ETS1 via this second site is enhanced by hepatocyte growth factor-dependent ETS1 activation, thereby MET indirectly promotes its own expression. We further find that expression of a dominant-negative ETS1 reduces the ability of melanoma cells to grow both in culture and in vivo. Thus, we discover a pathway where ETS1 advances melanoma through the expression of MET via PAX-dependent and -independent mechanisms.


Conflict of interest statement

Conflict of interest statement: The authors declare no conflict of interest.

Figures

Figure 1
Figure 1
PAX3, ETS1, and MET proteins are expressed in melanoma cells and primary tumor samples. (A,B) Melanoma cell lines (lanes 1–7) express varying levels of PAX3, ETS1, MET (A), and phosphorylated ETS1 (pETS1) (B). Western blots were probed with vinculin antibody as a loading control. Cell line 3T3 (lane 8) served as negative controls for PAX3 and MET in (A), and lysate from mel-624 treated with calf-intestinal phosphatase (CIP) was a negative control for pETS1. (C–L) Immunofluorescence analysis of PAX3, ETS1, pETS1, MET, and pMET in superficial spreading melanoma primary tissue. Representative samples demonstrating PAX3 and MET (C–F) or ETS1 and MET (G–J) co-expression, with DAPI-stained nuclei (blue, C,G), PAX3 (red, D), ETS1 (red, H), MET (green, E, I), and red/green dual channel combination (F,J). Representative samples of pETS1 and pMET immunofluorescence (K,L). Dotted lines represent the dermal/epidermal junction layer. (M) Summary table of samples that expressed specific antigens.
Figure 2
Figure 2
The MET promoter 5′ proximal to the transcriptional start contains putative PAX and ETS sites. (A) Sequence from the MET locus, including 297 bp 5′ upstream to the transcriptional start site (arrow), and 25 bp of 5′ UTR that includes a SMAD SBE site (48), MITF site (39, 40), and HES/NOTCH site (49). A PAX site is indicated −752 to −746 by a black box. Putative ETS sites are shown −241 to −236 on the reverse strand of the sequence (ETS/P (E1), box) and −85 to −79 (ETS (E2), underline). (B) Nomenclature and schematics of MET reporter constructs containing the promoter sequence shown in (A) driving the reporter gene lucifierase. Constructs contain wild-type PAX (P) and ETS (E1 and E2) sites as shown in A or the sites that are mutated shown schematically with an X.
Figure 3
Figure 3
PAX3 and ETS1 activate the proximal MET promoter. (A) MET promoter reporter constructs, shown schematically in Figure 2, were transfected into 293T cells with PAX3 (white bars), ETS1 (grey bars), or both (black bars). Each bar represents n=9, with standard error of the mean as shown. Differences between synergistic activation of set 1 and the other sets are significant (p<0.05 set 4, p<0.005 other sets). (B) P/E1 and E2 probe sequences utilized in EMSA analysis. (C) PAX3 and ETS1 bind to elements within the MET promoter. Two EMSA probes were utilized, containing either the P and E1 sites (lanes 1–6) or the E2 site (lanes 7–10). Lanes contain either probe alone (lanes 1,7), with the addition of GST (lanes 2,8), PAX3 (lanes 3,4), or ETS1 (lanes 5,6,9,10) proteins. Cold probe was added in 100 times excess as a specific competitor (lanes 4, 6,10). Slower migrating bands are seen with the addition of PAX3 (lane 3, arrows B, C) or ETS1 (lane 9, arrows A, C).
Figure 4
Figure 4
PAX3 and ETS1 activate MET in melanoma cells. (A) PAX3 and ETS1 interact in melanoma cells. A375 and mel-624 cell lysates were immunoprecipitated without (lanes 1,2,4,5) or with ETS1 antibodies (lanes 3,6). Immunoprecipitants were probed by western analysis for the presence of PAX3. (B) PAX3 and ETS1 directly interact. Recombinant proteins were immunoprecipitated ETS1 antibody then probed for PAX3 expression (top row) or immunoprecipitated with PAX3 antibody then probed for ETS1 expression (bottom row). (C) PAX3 is located on the endogenous MET promoter in A375 and mel-624 cells. Chromatin immunoprecipitation (ChIP) analysis was performed with primers specific for the MET promoter (top gels) or exon 4 of the beta tubulin gene (bottom gels, negative control) in A375 (lanes 1–5), mel-624 (lanes 6–10), and 3T3 (11–15, negative control) cell lysates. Antibodies utilized for immunoprecipitations were against PAX3 (lane 1,6,11), ETS1 (lane 2,7,12), or normal mouse IgG (negative control, lane 3,8,13). Input DNA (positive control, lane 4,9,14) and water-blank without template DNA (negative control, lane 5,10,15) acted as PCR controls. Input DNA was collected for each sample after cell sonication but before immunoprecipitation. (D) PAX and ETS sites are active in A375 and mel-624 melanoma cells. MET promoter reporter constructs, shown schematically in Figure 2, were transfected into cells with the wild-type MET promoter sequence, or with the P, E1 and/or E2 sites mutated. Percent light units was calculated by dividing the light units generated from each set by the light units of the wild-type MET promoter, then multiplying by 100. Each bar represents n=9, with standard error of the mean as shown. Differences between wild-type METpm and all of the tested mutant constructs were significant for both cell lines, p<0.005. (E, F) Inhibition of PAX3 and ETS1 expression in mel-624 cells leads to a reduction of MET levels. Cells were transfected with scrambled control siRNA (lane 1) PAX3 or ETS1 gene specific siRNA alone (lanes 2,3), or together (lane 4). Graphs shown in F are quantified densitometry readings of MET bands from western analysis from E, (n=3). All densitometry readings were normalized against vinculin loading controls. MET expression was reduced significantly (p<0.02) to 30%±14.7% in PAX3 and ETS1 siRNA transfected cells compared to siScramble.
Figure 5
Figure 5
ETS1 synergistically activates MET with PAX3 or HGF. (A) MET is expressed in 293T cells but not in 3T3 cells. Western analysis for MET and vinculin (loading control) in 293T and 3T3 cells. (B, C) ETS1 and PAX3 activate MET synergistically in 293T and 3T3 cells, while a synergistic effect of ETS1 and HGF is only seen in 293T cells. Luciferase assays of 293T (B) and 3T3 (C) cells transfected with the wild-type METpm (shown schematically in Figure 2B) and ETS1, with the addition of PAX3 or exogenous HGF. Increased levels of luciferase were significant for all samples in comparison to vector alone (293T: p<0.005, 3T3: p<0.05), and between ETS1 + HGF in 293T cells and ETS1 + PAX3 in both cell lines in comparison to ETS1 alone (p<0.05). The levels of luciferase did not increase significantly in 3T3 cells with the addition of HGF and ETS1 in comparison to ETS1 alone (p=0.475). (D) Schematic of the HGF/MET/MAPK phosphorylation site on epitope T38 of ETS1. In the ETS1(T38A) mutant protein, a mutation of T38 to an alanine abrogates the ability of MAPK to phosphorylate ETS1 (–25). (E) The ETS1(T38A) mutant synergistically activates MET expression with PAX3 but not with HGF. Luciferase assays of 293T cells transfected with either ETS1 or ETS1(T38A), with or without the addition of HGF or PAX3. Each bar represents n=9, with standard error of the mean as shown. The addition of HGF or PAX3 to ETS1, or HGF to ETS1(T38A) transfected cells led to a significant fold increase in luciferase versus ETS1 proteins alone (p<0.005). Conversely, HGF was unable to increase overall luciferase levels in comparison to ETS1(T38A) alone (p=0.172). (F) Mutation of ETS1(T38A) abrogates ETS1 phosphorylation after HGF treatment. 293T cells transfected with empty vector (pcDNA3), ETS1 wild-type, and ETS1(T38A) expression constructs are grown in the absence (−) or presence (+) of exogenous HGF. Western blots were probed with antibodies against MET, phosphorylated MET (pMET), ERK, pERK, ETS1, and pETS1. Vinculin antibody was included as a loading control. (G, H) HGF increases the levels of pETS1 in 5/6 melanoma cell lines. Protein lysates from cells without (−) or with (+) the addition of HGF treatment were tested for the expression of MET, pMET, ETS1, pETS1 and vinculin. Lysate from mel-624 treated with calf-intestinal phosphatase (CIP) was a negative control for phosphorylated proteins. Band intensity for pETS1 was measured by densitometry for three independent experiments (shown graphically in H). Levels for pETS1 post HGF treatment, in comparison to untreated cells, increased significantly (p<0.05) in all cell lines except for SKMEL-28 (p=0.218). (I) Treatment with a MEK-specific inhibitor, PD184352, decreases pETS1 levels. Protein lysates from A375 and mel-624 cells untreated, mock treated (DMSO), or treated with PD1184352 were tested for the expression of MET, ERK, pERK, ETS1, pETS1, and vinculin. Lysates treated with CIP served as a negative control for phosphorylated proteins. All Western analyses shown are representatives of three independent experiments.
Figure 6
Figure 6
The MET promoter contains two ETS-responsive enhancers that work synergistically with either PAX3 or HGF stimulation. (A) ETS1 synergistically activates the MET promoter with PAX3 through enhancer E1, and HGF via enhancer E2. Luciferase assays of 293T cells transfected with MET promoter constructs with wild-type E1 and E2 enhancer sequence (set 1), E1 mutated (set 2), E2 mutated (set 3), or with both E1 and E2 mutated (set 4). The reporter constructs were transfected with ETS1 (white bars), ETS1 and PAX3 (grey bars), or ETS1 with exogenous HGF (black bars). Fold induction was calculated by measuring luciferase activity in arbitrary light units, normalized against beta-galactosidase activity, then divided by the measurements obtained for reporter vector alone (n=9). (B) Schematic summarizing ETS1 activation of the MET promoter through the E1 and E2 elements. The E1 site has a PAX-dependent ETS1 binding sequence with a PAX site directly proximal; ETS1 synergistically activates the MET promoter with PAX3 through E1. The E2 site contains an ideal ETS1 binding site, and ETS1 synergistically activates the MET promoter through this site with exogenous HGF.
Figure 7
Figure 7
Expression of a dominant-negative ETS1 (DN-ETS1) protein inhibits MET induction and melanoma cell growth. (A) A schematic of wild-type ETS1 and DN-ETS1 proteins. (B) DN-ETS1 inhibits the activation of the MET promoter by both PAX3 and ETS1. Luciferase assays of 293T cells transfected with METpm, in the presence (+) or absence (−) of PAX3, ETS1, and/or DN-ETS1 expression vectors. Fold induction was calculated by measuring luciferase activity in arbitrary light units, normalized against beta-galactosidase activity, and divided by the measurements obtained for reporter vector alone (n=9, p<0.005). (C) A western analysis detects DN-ETS1 expression in A375 melanoma cells utilizing an antibody that recognizes the C-terminal of ETS1 (ETS1/2 antibody). (D) DN-ETS1 attenuates melanoma cell growth. A375 and mel-624 cells were transfected with either a GFP or a dual DN-ETS1/GFP expressing construct, and green cells were counted after cells were transfected and at 48 hours post transfection. The “% starting cell numbers” were calculated as GFP-expressing cell numbers at 48 hours post-transfection divided by starting cell numbers, then multiplied by 100 (n=3, p<0.005). (E) DN-ETS1 attenuates tumor formation in vivo. A375 cells were transfected with either a GFP or a dual DN-ETS1/GFP expression construct and transplanted into the flanks of nu/nu mice. While all A375 cells transfected with GFP formed tumors ten days after transplantation, only 2/6 of DN-ETS1 formed any palpable tumors with significant inhibition of tumor formation (p<0.05). For each group, n=6.

References

    1. Oikawa T, Yamada T. Molecular biology of the Ets family of transcription factors. Gene. 2003;303:11–34. - PubMed
    1. Keehn CA, Smoller BR, Morgan MB. Expression of the ets-1 proto-oncogene in melanocytic lesions. Mod Pathol. 2003;16(8):772–7. - PubMed
    1. Rothhammer T, Hahne JC, Florin A, Poser I, Soncin F, Wernert N, et al. The Ets-1 transcription factor is involved in the development and invasion of malignant melanoma. Cell Mol Life Sci. 2004;61(1):118–28. - PMC - PubMed
    1. Dong L, Jiang CC, Thorne RF, Croft A, Yang F, Liu H, et al. Ets-1 mediates upregulation of Mcl-1 downstream of XBP-1 in human melanoma cells upon ER stress. Oncogene. 2011;30(34):3716–26. - PMC - PubMed
    1. Tajima A, Miyamoto Y, Kadowaki H, Hayashi M. Mouse integrin alphav promoter is regulated by transcriptional factors Ets and Sp1 in melanoma cells. Biochim Biophys Acta. 2000;1492(2–3):377–84. - PubMed

Publication types