

The perception of naturalness correlates with low-level visual features of environmental scenes
- PMID: 25531411
- PMCID: PMC4273965
- DOI: 10.1371/journal.pone.0114572
The perception of naturalness correlates with low-level visual features of environmental scenes
Abstract
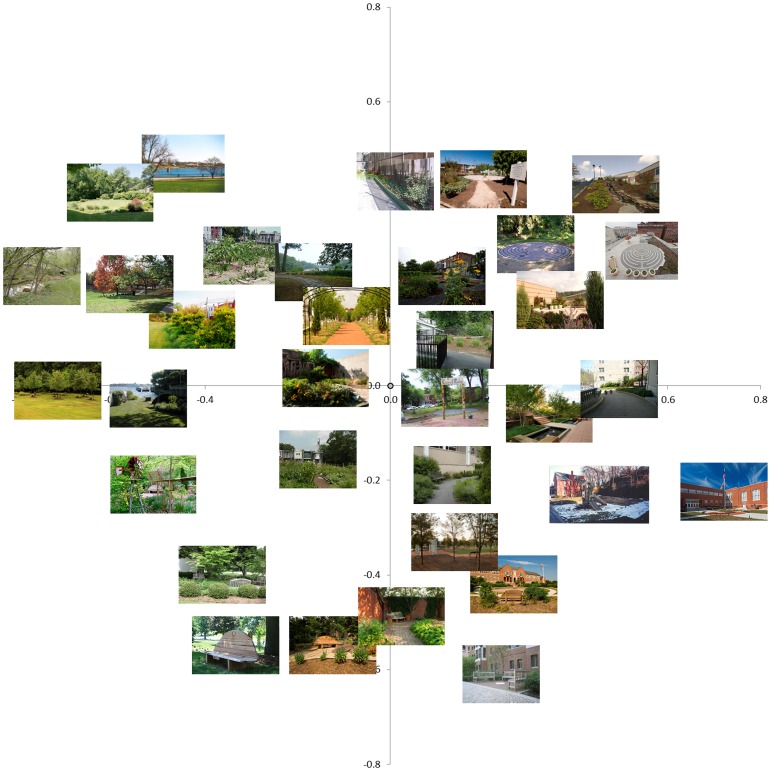
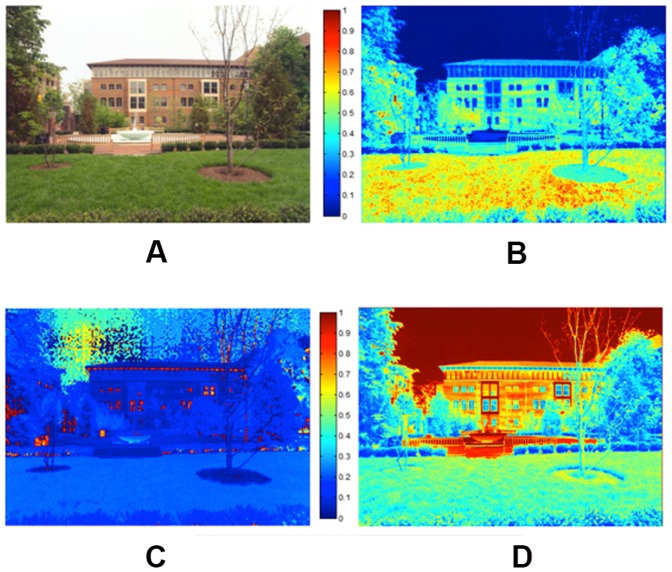
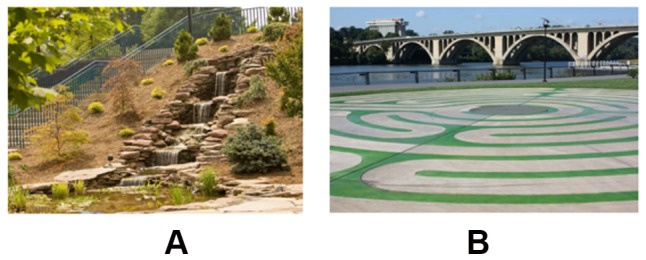
Previous research has shown that interacting with natural environments vs. more urban or built environments can have salubrious psychological effects, such as improvements in attention and memory. Even viewing pictures of nature vs. pictures of built environments can produce similar effects. A major question is: What is it about natural environments that produces these benefits? Problematically, there are many differing qualities between natural and urban environments, making it difficult to narrow down the dimensions of nature that may lead to these benefits. In this study, we set out to uncover visual features that related to individuals' perceptions of naturalness in images. We quantified naturalness in two ways: first, implicitly using a multidimensional scaling analysis and second, explicitly with direct naturalness ratings. Features that seemed most related to perceptions of naturalness were related to the density of contrast changes in the scene, the density of straight lines in the scene, the average color saturation in the scene and the average hue diversity in the scene. We then trained a machine-learning algorithm to predict whether a scene was perceived as being natural or not based on these low-level visual features and we could do so with 81% accuracy. As such we were able to reliably predict subjective perceptions of naturalness with objective low-level visual features. Our results can be used in future studies to determine if these features, which are related to naturalness, may also lead to the benefits attained from interacting with nature.
Conflict of interest statement
Figures


References
-
- Berman MG, Jonides J, Kaplan S (2008) The Cognitive Benefits of Interacting With Nature. Psychological Science 19:1207. - PubMed
-
- Kaplan S, Berman MG (2010) Directed Attention as a Common Resource for Executive Functioning and Self-Regulation. Perspectives on Psychological Science 5:43. - PubMed
-
- Berto R (2005) Exposure to restorative environments helps restore attentional capacity. Journal of Environmental Psychology 25:249.
-
- Taylor AF, Kuo FE (2009) Children With Attention Deficits Concentrate Better After Walk in the Park. Journal of Attention Disorders 12:402. - PubMed
Publication types
MeSH terms
LinkOut - more resources
Full Text Sources
Other Literature Sources
Research Materials
