Meta-Analysis
. 2014 Dec 22:5:5893.
doi: 10.1038/ncomms6893.

Transcriptome meta-analysis of lung cancer reveals recurrent aberrations in NRG1 and Hippo pathway genes

Affiliations
Meta-Analysis

Transcriptome meta-analysis of lung cancer reveals recurrent aberrations in NRG1 and Hippo pathway genes

Saravana M Dhanasekaran et al. Nat Commun. .

Abstract

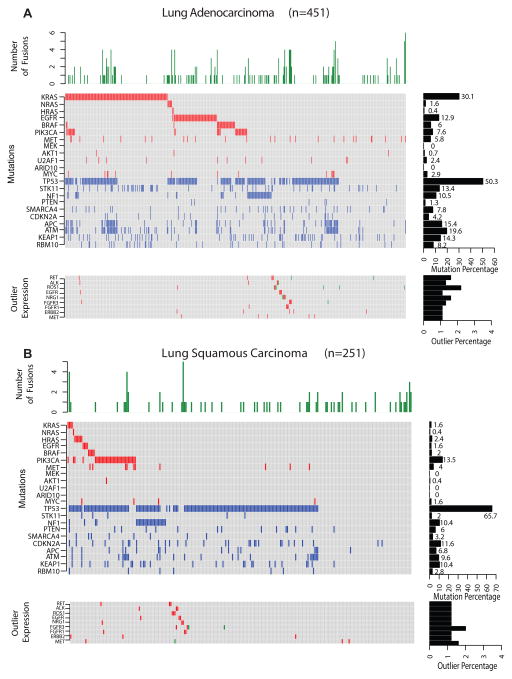
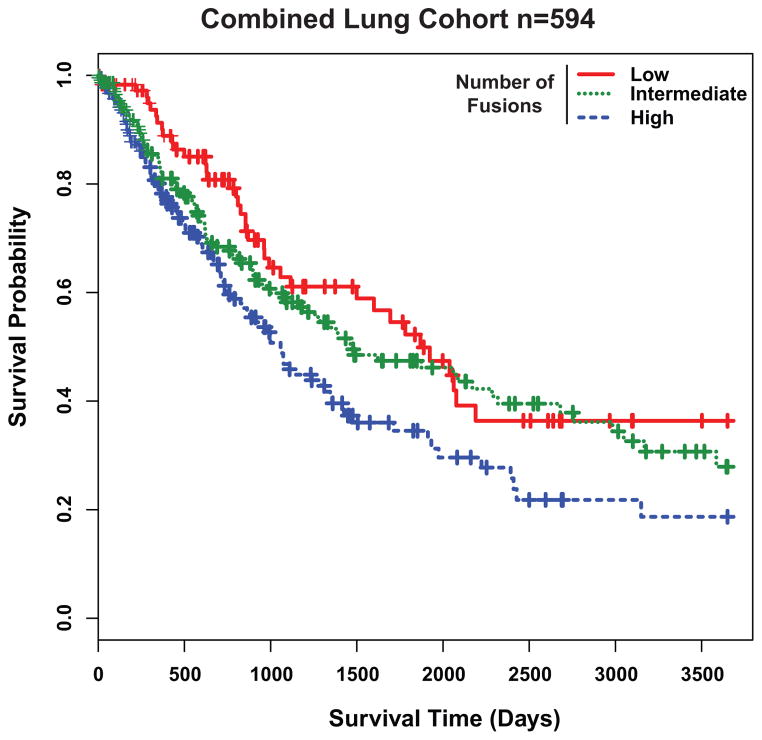
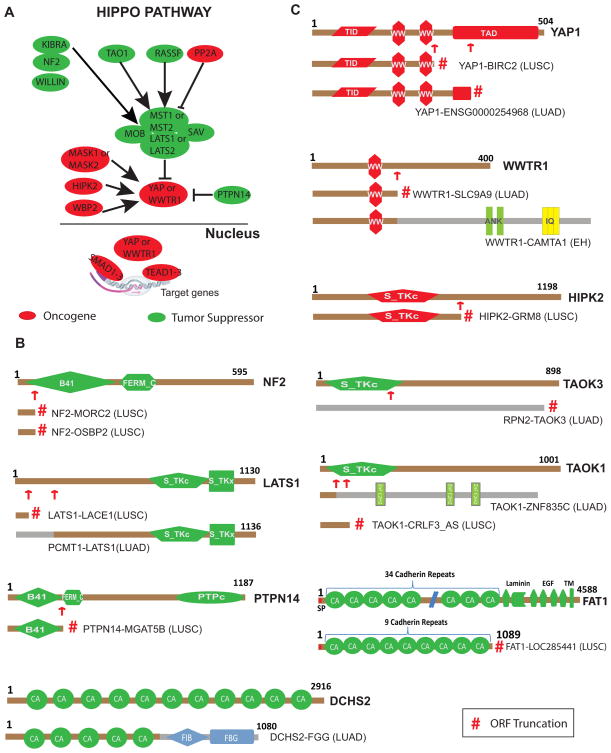
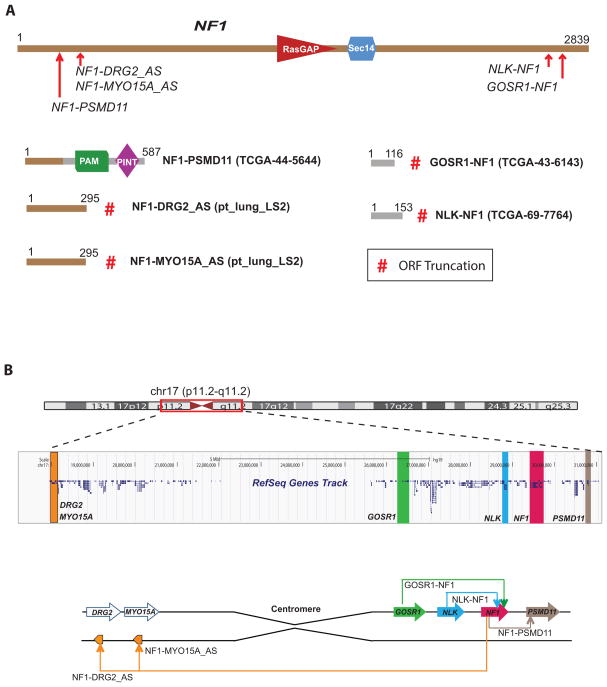
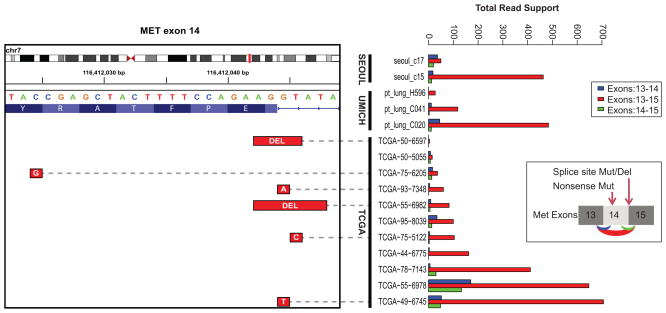
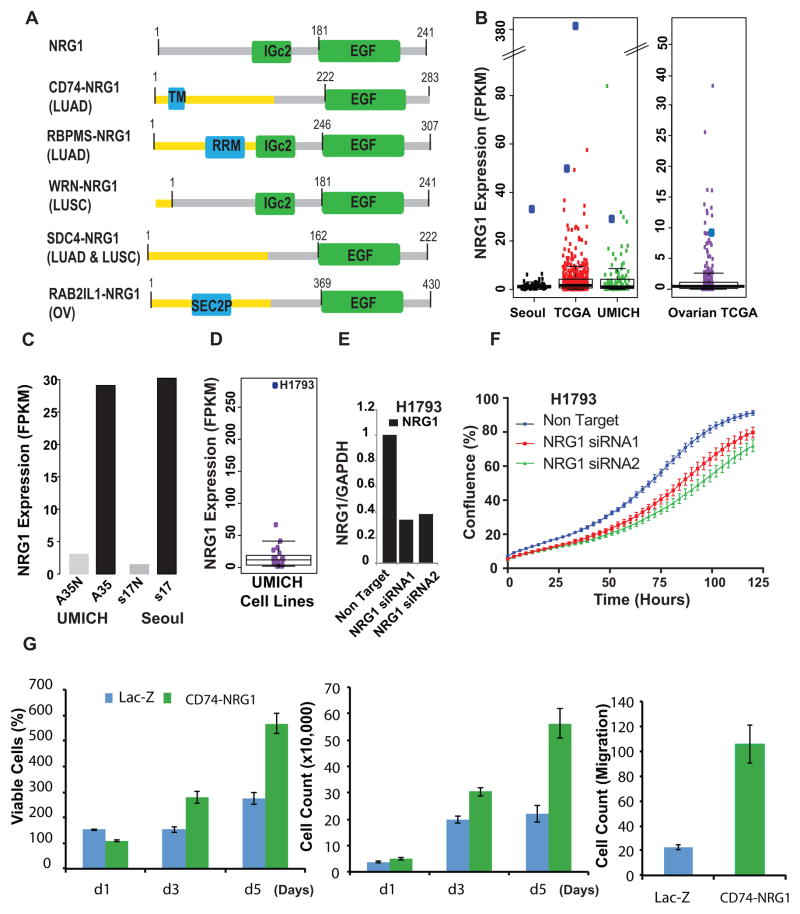
Lung cancer is emerging as a paradigm for disease molecular subtyping, facilitating targeted therapy based on driving somatic alterations. Here we perform transcriptome analysis of 153 samples representing lung adenocarcinomas, squamous cell carcinomas, large cell lung cancer, adenoid cystic carcinomas and cell lines. By integrating our data with The Cancer Genome Atlas and published sources, we analyse 753 lung cancer samples for gene fusions and other transcriptomic alterations. We show that higher numbers of gene fusions is an independent prognostic factor for poor survival in lung cancer. Our analysis confirms the recently reported CD74-NRG1 fusion and suggests that NRG1, NF1 and Hippo pathway fusions may play important roles in tumours without known driver mutations. In addition, we observe exon-skipping events in c-MET, which are attributable to splice site mutations. These classes of genetic aberrations may play a significant role in the genesis of lung cancers lacking known driver mutations.


Figures

Fig. 1
Fig. 1
The gene fusion and mutational landscape of lung cancers. A, Lung adenocarcinoma (LUAD, n=451). B, Lung squamous carcinoma (LUSC, n=251). Top panels represent histograms depicting the number of high quality gene fusions identified in each sample. Central panels denote the presence or absence of activating mutations in known oncogenes (red), deleterious mutations in tumor suppressors (blue) no aberration (gray). Samples are represented in columns and genes in rows. Right middle panel are bar plot summarizing the number of samples harboring activating or deleterious mutations for each gene. Bottom panels indicate samples harboring both known and novel gene fusions (in green) involving either receptor kinase genes or NRG1. Samples in red indicate outlier expression pattern observed in the respective genes. Cohorts of additional non-small cell lung cancers including lung adenoid cystic carcinoma (ACC) (n=11) and large cell carcinomas (n=9) were also analyzed included in Supplementary Table 2.
Fig. 2
Fig. 2
Gene fusion numbers correlates with lung cancer prognosis. A, Kaplan-Meier analysis for the combined cohort of lung cancer samples (n=594) with low (0–7) (n=124), intermediate (8–16) (n=237), or high (≥17) (n=233) number of fusions (Likelihood Ratio Test P=0.008). Samples with high number of fusions have worse prognosis (Cox survival analysis P=0.005). Individual Kaplan-Meier analyses with LUAD and LUSC samples are found in Supplementary Fig. 4A and 4B respectively.
Fig. 3
Fig. 3
Gene fusions among the Hippo pathway genes in lung cancer. A, Schematic representation of core and associate members of the Hippo pathway adapted from Harvey et al. Potential tumor suppressors are represented in green, while potential oncogenes are indicated in red. Phosphorylation of YAP or TAZ by LATS retains them in the cytoplasm and hinders their transcriptional regulation. B, Fusions in putative oncogenes of the Hippo pathway. C, Fusions in putative tumor suppressors of the Hippo pathway. For all fusion schematics represented, the wild-type Hippo pathway protein domain structure is presented first, numbers indicate total amino acids and domain names are abbreviated. Red arrows show the fusion junctions and red # symbol indicate protein truncation due to out-of-frame ORFs from fusion transcript analysis. The schematic of the previously reported TAZ-CAMTA1 fusion in epithelioid hemangioendothelioma (EH) is also displayed. Protein abbreviations: MST1/2-STE20-like protein kinase; LATS1/2-Large Tumor Suppressor Homolog Kinase; YAP1-Yes-associated Protein 1; WWTR1-ww-Domain Containing Transcription Regulator 1; TEAD-TEA-Domain Family; HIPK2 Homeodomain Interacting Protein Kinase 2; TAOK1/3-TAO Kinase; FAT1-FAT Atypical Cadherin 1; DCHS2-Dachsous Cadherin-related 2; PTPN14-Protein Tyrosine Phosphatase, Non-receptor Type 14. Domain abbreviations: B4-Band 4.1 homologues; FERM_C-FERM C-terminal PH-like Domain; S_TKc-Serine/Threonine Protein Kinases, Catalytic Domain; PTPc-Protein Tyrosine Phosphatase, Catalytic Domain; CA-Cadherin Repeats; FIB-Fibrinogen; FBG-Fibrinogen-related Domains; WW-Domain with 2 conserved Trp (W) residues; TID-TEAD Interacting Domain; TAD-Transactivation Domain; ANK-Ankyrin Repeats; IQ-Short Calmodulin-binding Motif; EGF-Epidermal Growth Factor-like Domain; ZnFC2H2-Zinc Finger; TM-Transmembrane Domain.
Fig. 4
Fig. 4
Inactivating gene fusions of NF1 in lung cancer. A, NF1 protein schematic and the observed fusion breaks (red arrows) in the index cases are displayed on top. Recurrent NF1 fusions with partners (GOSR1, PSMD11, NLK, DRG2 and MYO15A antisense) resulted in loss of the NF1 gene as illustrated by the corresponding fusion protein structure below. Index samples are indicated in parenthesis and the numbers over the protein schematic indicate total amino acids. Red # symbol indicate protein truncation due to out-of-frame ORFs from fusion transcript analysis. B, UCSC browser view of genomic location of NF1 gene and its fusion partners (Top). Schematic representation of various NF1 rearrangements on chromosome 17 identified in lung cancer (Bottom).
Fig. 5
Fig. 5
Recurrent activating MET exon skipping events. Right Panel: An activating MET exon-14 skipping event was observed in a total of 15 samples across all three cohorts. The total reads support each splice variant exon13–14 (blue), exon13–15(red) and exon14-15 (green) are represented in the bar plot on the right. In 5 out 11 TCGA samples where DNA mutation data was available, skipping of MET exon-14 was accompanied by a mutation affecting the splice donor site adjacent to position D1010 (illustrated inset on the right). Additionally one sample harbored a non-sense mutation g.chr7:116412024C>Gp.Y1003*, which accompanied exon-14 skipping. Left Panel: IGV browser view of splice site deletions/mutations in the corresponding samples.
Fig. 6
Fig. 6
Recurrent NRG1 rearrangements in lung cancer. A, Recurrent fusions involving NRG1 as a 3′ partner were detected in lung adenocarcinoma and lung squamous carcinoma in the three cohorts included in this study. Schematic representation of functional domains present in the NRG1 fusion proteins namely CD74-NRG1; RBPMS-NRG1 (LUAD); WRN-NRG1 (LUSC); SDC4-NRG1 (LUSC) and RAB2IL1-NRG1 (ovarian cancer from TCGA) compared to the wild-type NRG1 (Top). The receptor binding EGF domain is preserved in all fusions. TM, transmembrane domain; RRM- domain; IGc2- domain; SEC2P-domain. B, Analysis of RNASeq expression values revealed outlier NRG1 mRNA expression in all index cases (large blue dots) within each cohort. C, High NRG1 mRNA expression driven by the fusion event in the index tumor tissue compared to matched normal, in both an LUAD patient in the University of Michigan and Seoul cohorts. D, Boxplot showing outlier expression of NRG1 in H1793 in the University of Michigan lung cell line cohort. E, Two independent siRNAs mediated knockdown of NRG1 in H1793 cells as assessed by Q-PCR. F, Knock-down of NRG1 decreased cell proliferation as monitored by IncuCyte confluence analysis. G, Overexpression of NRG1 induces cell proliferation and migration. Cell proliferation by WST-1 assay (left panel) and cell counting (middle panel) on BEAS-2B cells stably transfected with Lac-Z or CD74-NRG1 fusion. Both assays demonstrated that cells expressing the CD74-NRG1 fusion had significantly higher proliferation rate at day 3 and 5 (Student’s t-test P<0.001 for both time-points) as compared to Lac-Z. The right panel represents a cell migration assay after 24 hours. BEAS-2B cells expressing CD74-NRG1 fusion showed a higher migration rate as compared to Lac-Z (Student’s t-test P=0.0014).

References

    1. Ferlay J, Shin HR, Bray F, Forman D, Mathers C, Parkin DM. Estimates of worldwide burden of cancer in 2008: GLOBOCAN 2008. International journal of cancer Journal international du cancer. 2010;127:2893–2917. - PubMed
    1. Siegel R, Naishadham D, Jemal A. Cancer statistics, 2013. CA: a cancer journal for clinicians. 2013;63:11–30. - PubMed
    1. Nakamura H, Saji H. A worldwide trend of increasing primary adenocarcinoma of the lung. Surg Today. 2013 - PubMed
    1. Ding L, et al. Somatic mutations affect key pathways in lung adenocarcinoma. Nature. 2008;455:1069–1075. - PMC - PubMed
    1. Weir BA, et al. Characterizing the cancer genome in lung adenocarcinoma. Nature. 2007;450:893–898. - PMC - PubMed

Publication types

MeSH terms