. 2015;6(1):10-23.
doi: 10.4161/19490976.2014.990790. Epub 2015 Jan 20.

Antibiotic-induced dysbiosis alters host-bacterial interactions and leads to colonic sensory and motor changes in mice

Affiliations

Antibiotic-induced dysbiosis alters host-bacterial interactions and leads to colonic sensory and motor changes in mice

M Aguilera et al. Gut Microbes. 2015.

Abstract

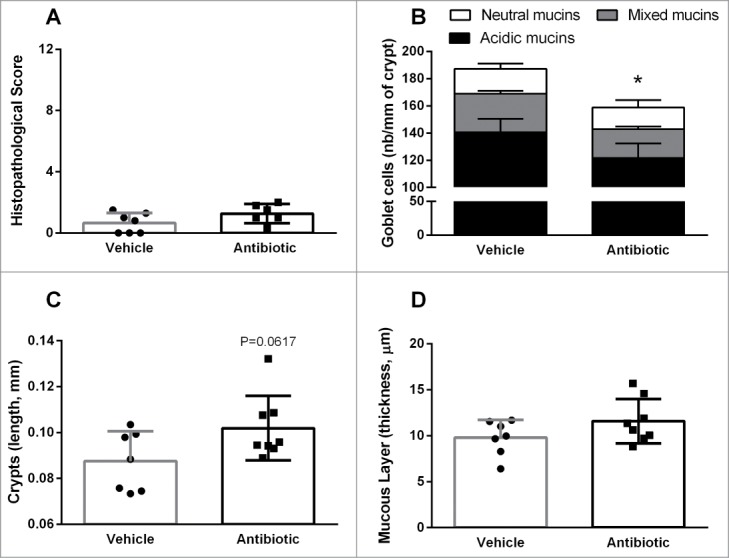
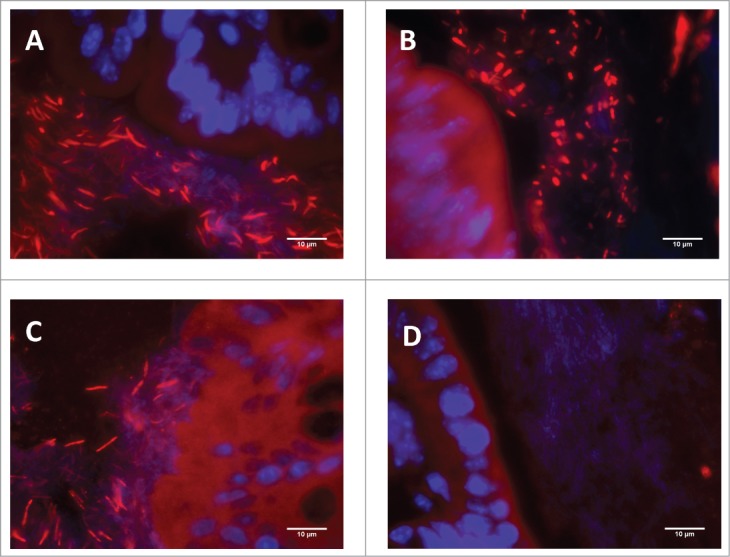
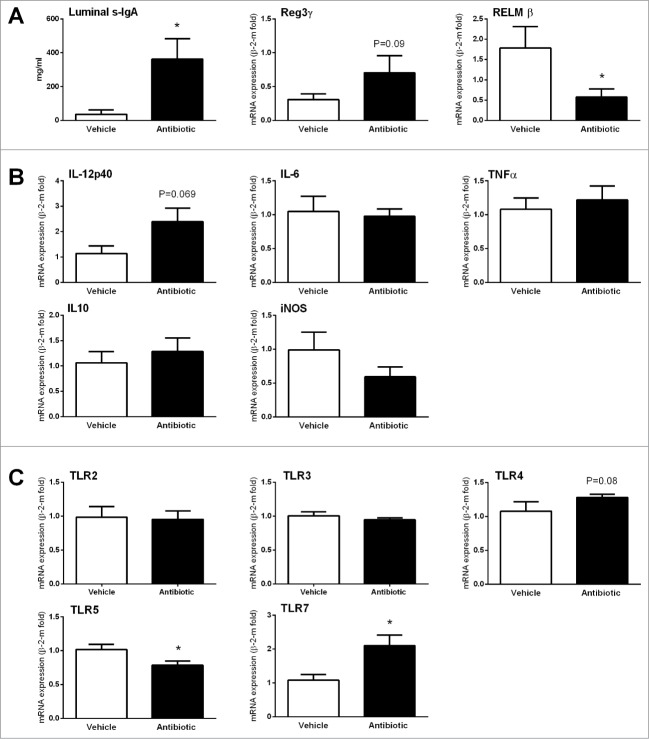
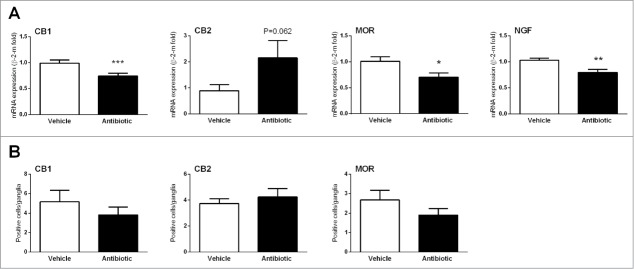
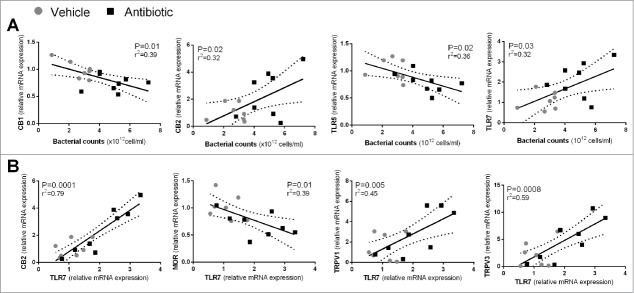
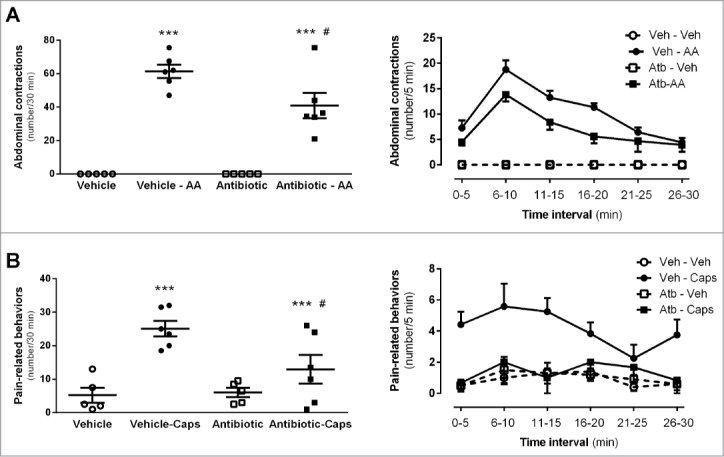
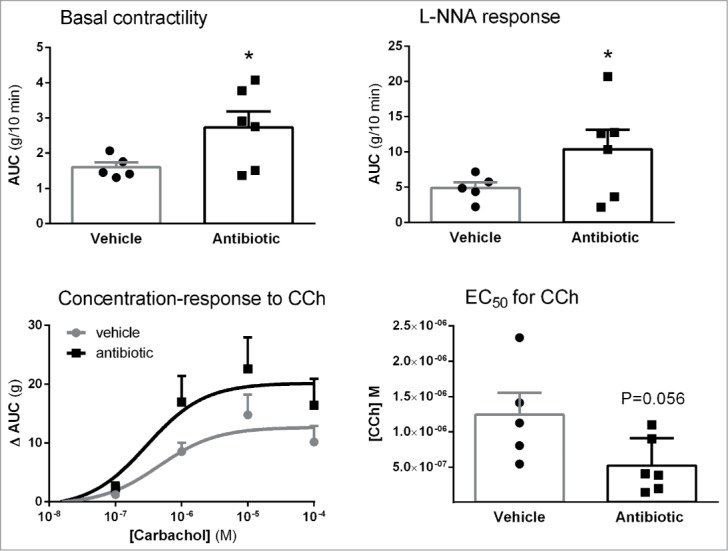
Alterations in the composition of the commensal microbiota (dysbiosis) seem to be a pathogenic component of functional gastrointestinal disorders, mainly irritable bowel syndrome (IBS), and might participate in the secretomotor and sensory alterations observed in these patients.We determined if a state antibiotics-induced intestinal dysbiosis is able to modify colonic pain-related and motor responses and characterized the neuro-immune mechanisms implicated in mice. A 2-week antibiotics treatment induced a colonic dysbiosis (increments in Bacteroides spp, Clostridium coccoides and Lactobacillus spp and reduction in Bifidobacterium spp). Bacterial adherence was not affected. Dysbiosis was associated with increased levels of secretory-IgA, up-regulation of the antimicrobial lectin RegIIIγ, and toll-like receptors (TLR) 4 and 7 and down-regulation of the antimicrobial-peptide Resistin-Like Molecule-β and TLR5. Dysbiotic mice showed less goblet cells, without changes in the thickness of the mucus layer. Neither macroscopical nor microscopical signs of inflammation were observed. In dysbiotic mice, expression of the cannabinoid receptor 2 was up-regulated, while the cannabinoid 1 and the mu-opioid receptors were down-regulated. In antibiotic-treated mice, visceral pain-related responses elicited by intraperitoneal acetic acid or intracolonic capsaicin were significantly attenuated. Colonic contractility was enhanced during dysbiosis. Intestinal dysbiosis induce changes in the innate intestinal immune system and modulate the expression of pain-related sensory systems, an effect associated with a reduction in visceral pain-related responses. Commensal microbiota modulates gut neuro-immune sensory systems, leading to functional changes, at least as it relates to viscerosensitivity. Similar mechanisms might explain the beneficial effects of antibiotics or certain probiotics in the treatment of IBS.

Keywords: AMP, antimicrobial peptide; CB1/2, cannabinoid receptor type 1 or 2; FGD, functional gastrointestinal disorder; FISH, fluorescent in situ hybridization; GCM, gut commensal microbiota; GI, gastrointestinal; IBS, irritable bowel syndrome; MOR, mu-opioid receptor; NGF, nerve growth factor; PPR, pattern recognition receptor; RELMβ, resistin-like molecule-β; RT-qPCR, reverse transcription quantitative polymerase chain reaction; Reg3γ, regenerating islet-derived protein 3 gamma; SFB, segmented filamentous bacteria; TLR, toll-like receptor; TPH 1/2, tryptophan hydroxylase isoforms 1 or 2; TRPV1/3, transient receptor potential vanilloid types 1 or 3; cannabinoid receptors; colonic motility; gut commensal microbiota; iNOS, inducible nitric oxide synthase; innate immune system; intestinal dysbiosis; opioid receptors; sIgA, secretory IgA; visceral sensitivity.


Figures

Figure 1.
Figure 1.
Colonic histopathology in vehicle- and antibiotic-treated mice. (A) Histopathological scores. (B) Goblet cell counts from PAS/AB pH = 2.5 stained-sections. (C) length of colonic crypts. (D) Thickness of the mucus layer, assessed on PAS/AB pH = 2.5 stained-sections. Bars represent the mean ± SEM, symbols represent individual animals. n = 7–8 per group, *: P < 0.05 vs. vehicle.
Figure 2.
Figure 2.
Characterization and quantification of luminal gut commensal microbiota. Data shows qPCR quantification of total bacteria and the main bacterial groups present in the colonic microbiota (see methods for details). Data are median (interquartile range) ± SD and are expressed as cells/g of feces; n = 7–8 for each group. *, **: P < 0.05 or 0.01 vs. vehicle group. The bottom-right graph shows the relative distribution of the ceco-colonic microbiota in vehicle- and antibiotic-treated mice. Data represent the relative abundance (percent) of the main bacterial groups present in the gut microbiota as quantified using qPCR. Relative percent composition was calculated taking as 100% the total counts of the different bacterial groups assessed (C. coccoides, Bacteroides spp., Bifidobacterium spp and Lactobacillus/Enterococcus spp).
Figure 3.
Figure 3.
Representative colonic tissue images showing Clostridium spp (identified by FISH using the EREC 482 probe) adherence to the colonic epithelium. (A) Vehicle-treated animal. (B) Antibiotic-treated animal. (C) Non-treated naïve animal maintained in the same conditions as the experimental groups; included here for comparative purposes. (D) Negative control (hybridized with the control non-specific fluorescent probe NON338). In all cases (AC) abundant bacteria was observed attached to the colonic epithelium. Note, however, that bacillary-shaped bacteria were observed in vehicle-treated animals (A) (similarly to that observed in the non-treated naïve animal, (C) while in antibiotic-treated animals (B) a shift in morphology, with the appearance of abundant coccoidal forms, can be observed.
Figure 4.
Figure 4.
Changes in immune and host-bacterial interaction markers. (A) Changes in innate immune-related markers: luminal levels of secretory IgA (S-IgA) and gene expression levels of antimicrobial peptides. (B) Changes in expression levels of pro- (IL-12p40, IL-6 and TNFα) and anti-inflammatory (IL-10) cytokines and the inducible nitric oxide synthase (iNOS). (C) Changes in the expression levels of TLRs. Data are mean ± SEM, n = 7–8 group, *: P < 0 .05 vs. vehicle.
Figure 5.
Figure 5.
Changes in sensory-related markers. (A) Changes in colonic gene expression of cannabinoid receptors 1 and 2 (CB1/2), mu-opioid receptors (MOR) and nerve growth factor (NGF). Data are mean ± SEM, n = 5–8 animals per group. *, **, ***: P < 0.05, 0.01 or 0.001 vs. vehicle. (B) Quantification of immunorreactive ganglionic cells within the myenteric plexus in vehicle- and antibiotic-treated animals. Data are mean ± SEM, of 5–8 animals per group; see methods for details of the quantification procedures.
Figure 6.
Figure 6.
(A) Correlations between total luminal bacterial counts and sensory-related (CB1 and CB2) markers or TLRs. (B) Correlations between expression levels of TLR7 and sensory-related markers. Each point represents an individual animal. Broken lines represent the 95 % confidence interval.
Figure 7.
Figure 7.
Effects of antibiotic treatment on visceral pain-related responses. A: Intraperitoneal acetic acid- (AA, 0.6%) induced abdominal contractions. The left graph shows the total number of abdominal contractions during the observation time (30 min) in the different experimental groups. Each point represents an individual animal; the horizontal lines with errors correspond to the mean ± SEM. ***: P < 0 .001 vs. respective non-AA-treated control group. #: P < 0.05 vs. vehicle-AA group. The graph to the right shows the time-course (in 5-min intervals) for the pain-related responses in the same animals. B: Intracolonic capsaicin- (Caps) evoked visceral pain-related behaviors. The left graph shows the total number of behaviors during the observation time (30 min) in the different experimental groups. Each point represents an individual animal; the horizontal lines with errors correspond to the mean ± SEM. ***: P < 0.001 vs. respective non-capsaicin-treated control group. #: P < 0.05 vs. vehicle-Caps group. The graph to the right shows the time-course (in 5-min intervals) for the observation of pain-related behaviors in the same animals.
Figure 8.
Figure 8.
Effects of antibiotic treatment on colonic contractility assessed in vitro: basal contractility; contractile responses to NO-synthase inhibition with LNNA; Concentration-response curves to cholinergic stimulation with carbachol (CCh) and corresponding EC50s. Data are mean ± SEM, n = 5–6 per group, each point represents an individual animal (except for the concentration-response curves, where only mean ± SEM is shown). *: P < 0.05 vs. vehicle.

References

    1. Sood R, Law GR, Ford AC. Diagnosis of IBS: symptoms, symptom-based criteria, biomarkers or “psychomarkers”? Nat Rev Gastroenterol Hepatol 2014; 11(11):683-91; http://dx.doi.org/10.1038/nrgastro.2014.127 - DOI - PubMed
    1. Simrén M. IBS with intestinal microbial dysbiosis: a new and clinically relevant subgroup? Gut 2014; 63:1685-6; PMID:24569059; http://dx.doi.org/10.1136/gutjnl-2013-306434 - DOI - PubMed
    1. Lee YJ, Park KS. Irritable bowel syndrome: emerging paradigm in pathophysiology. World J Gastroenterol 2014; 20:2456-69; PMID:24627583; http://dx.doi.org/10.3748/wjg.v20.i10.2456 - DOI - PMC - PubMed
    1. Ishihara S, Tada Y, Fukuba N, Oka A, Kusunoki R, Mishima Y, Oshima N, Moriyama I, Yuki T, Kawashima K, et al. . Pathogenesis of irritable bowel syndrome-review regarding associated infection and immune activation. Digestion 2013; 87:204-11; PMID:23712295; http://dx.doi.org/10.1159/000350054 - DOI - PubMed
    1. O’Hara AM, Shanahan F. The gut flora as a forgotten organ. EMBO Rep 2006; 7:688-93; PMID:16819463;http://dx.doi.org/10.1038/sj.embor.7400731 - DOI - PMC - PubMed

Publication types

Substances