. 2015 Feb;18(2):310-5.
doi: 10.1038/nn.3905. Epub 2014 Dec 22.

NeuroGrid: recording action potentials from the surface of the brain

Affiliations

NeuroGrid: recording action potentials from the surface of the brain

Dion Khodagholy et al. Nat Neurosci. 2015 Feb.

Abstract

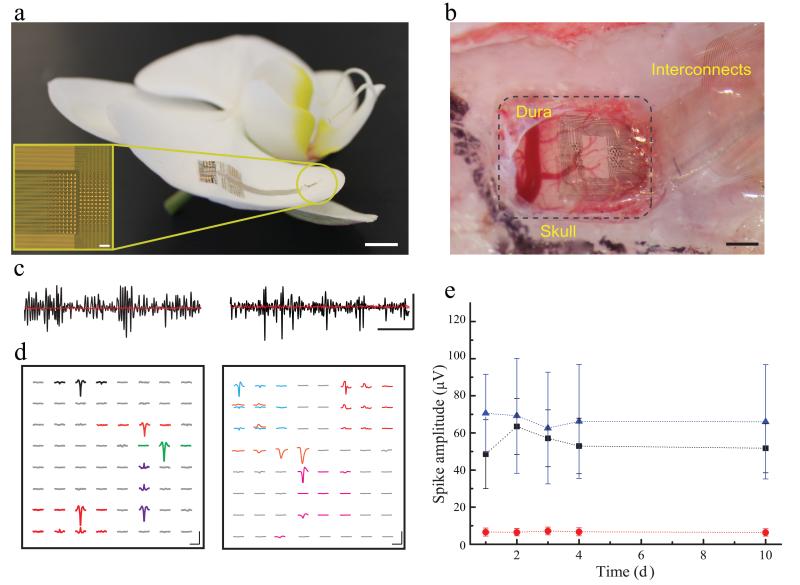
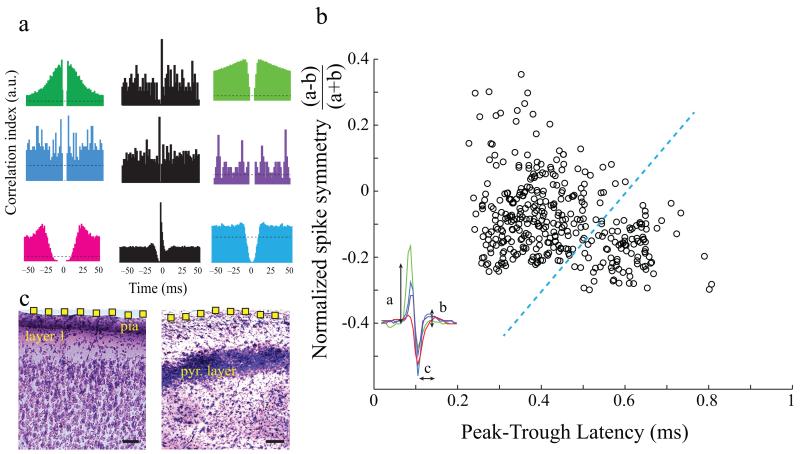
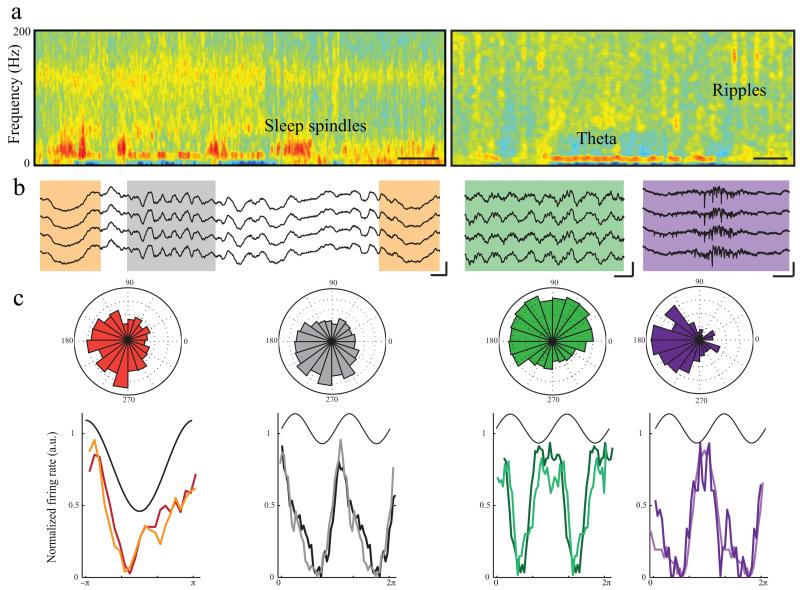
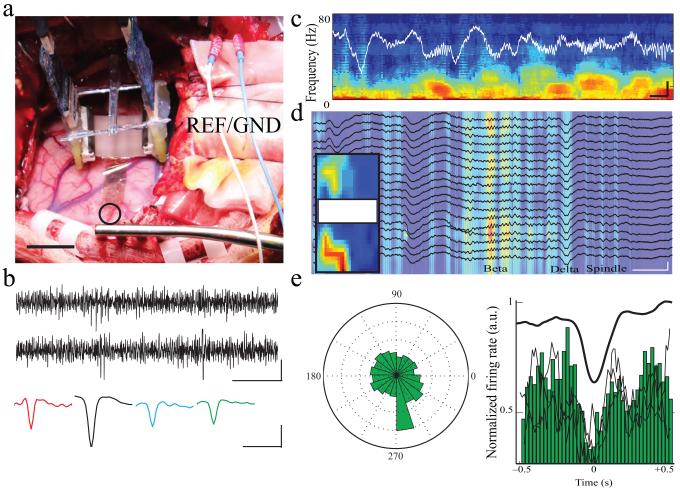
Recording from neural networks at the resolution of action potentials is critical for understanding how information is processed in the brain. Here, we address this challenge by developing an organic material-based, ultraconformable, biocompatible and scalable neural interface array (the 'NeuroGrid') that can record both local field potentials(LFPs) and action potentials from superficial cortical neurons without penetrating the brain surface. Spikes with features of interneurons and pyramidal cells were simultaneously acquired by multiple neighboring electrodes of the NeuroGrid, allowing for the isolation of putative single neurons in rats. Spiking activity demonstrated consistent phase modulation by ongoing brain oscillations and was stable in recordings exceeding 1 week's duration. We also recorded LFP-modulated spiking activity intraoperatively in patients undergoing epilepsy surgery. The NeuroGrid constitutes an effective method for large-scale, stable recording of neuronal spikes in concert with local population synaptic activity, enhancing comprehension of neural processes across spatiotemporal scales and potentially facilitating diagnosis and therapy for brain disorders.


Figures

Figure 1
Figure 1
NeuroGrid structure and spike recordings in freely moving rats. a) The NeuroGrid conforms to the surface of an orchid petal (scale = 5mm). Optical micrograph (inset) of a 256 electrode NeuroGrid (scale = 100 μm). Electrodes are 10 × 10 μm2 with 30 μm inter-electrode spacing. b) The NeuroGrid conforms to the surface of rat somatosensory cortex. The edge of the resected dura is visible in the top left corner of the craniotomy (scale = 1 mm). c) High-pass filtered (fc = 500Hz) time traces recorded in a freely moving rat from the surface of cortex (left) and hippocampus (right) in black. Corresponding postmortem filtered traces (rms noise = 3 μV at spike bandwidth) are in red (scale = 10 ms by 50 μV). d) Examples of the spatial extent of extracellular action potentials in cortex (left) and hippocampus (right) over the geometry of the NeuroGrid by spike-triggered averaging during the detected spike times (scale = 1.5 ms by 50 μV). e) Mean and standard deviation of the amplitude of detected action potential waveforms across 10 days of recording. The average amplitude and the variability of hippocampal waveforms (blue) are larger than cortical waveforms (black). The red curve demonstrates the spike detection threshold (rms noise = 8 μV at 0.1 – 7500 Hz).
Figure 2
Figure 2
Neuron clustering and spike waveform characterization. a) Sample autocorrelograms (in color) of putative single unit spiking from hippocampus (top 2 rows) and cortex (bottom row). Spiking cross-correlations (black) demonstrate excitatory and inhibitory interactions between putative single unit pairs. b) Scatterplot of waveform characteristics of putative single units recorded with the NeuroGrid reveals two broad clusters. Neurons were clustered according to waveform symmetry and mean wideband spike width. Each symbol corresponds to an average spike waveform of a putative isolated neuron. The symmetry of the waveform is defined by the comparison of the peaks of the spike (a and b) and the spike duration is defined by the latency of spike peak to trough (c) as illustrated in the inset figure. c) Nissl-stained coronal sections of cortex (left) and hippocampus (right) deep to NeuroGrid placement. Electrode location on the surface is estimated in yellow (electrodes not to scale; scale = 100 μm; pyr = pyramidal).
Figure 3
Figure 3
Phase modulation of NeuroGrid spikes by brain oscillations. a) Time-frequency spectrogram of LFP recorded by the NeuroGrid during sleep in cortex (left) and hippocampus (right). The cortical spectrogram during a NREM epoch contains sleep spindles (9 – 16 Hz) and slow oscillations (2 – 4 Hz). The hippocampal spectrogram manifests theta during a REM epoch (middle of panel) and ripples (100 – 150 Hz) during a NREM epoch (right of panel; scale = 10 s). b) Sample raw LFP traces demonstrating each oscillation (orange = slow oscillation, grey = spindle, scale = 100 ms by 250 μV; green = theta, scale = 250 ms by 250 μV; purple = ripple, scale = 100 ms by100 μV). c) Polar plots show phase-locking of sample neural firing to oscillations in cortex (left; slow oscillation and spindles) and hippocampus (right; theta and ripples). Histograms corresponding to above polar plots for each type of cortical and hippocampal oscillation on initial day of recording (matching color trace) and 10 days later (lighter color trace) demonstrate consistent phase modulation of units over time. Neocortical and hippocampal recordings are from different rats.
Figure 4
Figure 4
Intra-operative NeuroGrid recording of LFP and spikes in epilepsy patients. a) Surgical placement of the NeuroGrid on the surface of human brain (open circle). Acquisition electronics are suspended above the cortical surface. Two stainless steel needle electrodes served as ground and reference electrodes adjacent to the craniotomy (scale = 2 cm). b) High-pass filtered (fc = 250 Hz) time traces of the intra-operative NeuroGrid recordings containing spiking activity (scale = 20 ms by 40 μV). Sample spike waveforms obtained by spike-triggered averaging of spikes from different recording sites (scale = 1 ms, 40 μV). c) Sample time-frequency spectrogram of intra-operative recordings under anesthesia from an epilepsy patient (scale = 500 ms by 500 μV). d) Sample multi-channel LFP recording during intra-operative anesthesia (black traces) overlaid on time-frequency spectrogram filtered at beta frequency (18 – 25 Hz). Areas with high beta frequency power are located in spatially coherent clusters on the NeuroGrid (inset; scale = 500 ms, 750 μV). e) Polar plot and histogram demonstrating decreased spike firing during the trough of the slow oscillation. Black lines superimposed on the histogram correspond to phase modulation of spikes on different channels.

References

    1. Buzsáki G. Large-scale recording of neuronal ensembles. Nat. Neurosci. 2004;7:446–51. - PubMed
    1. Alivisatos AP, et al. The brain activity map. Science. 2013;339:1284–5. - PMC - PubMed
    1. Carandini M. From circuits to behavior: a bridge too far? Nat. Neurosci. 2012;15:507–9. - PubMed
    1. Adrian BYED, Moruzzi G. Impulses in the pyramidal tract. J. Physiol. 1939;97:153–199. - PMC - PubMed
    1. Wilson MA, McNaughton BL. Dynamics of the hippocampal ensemble code for space. Science. 1993;261:1055–8. - PubMed

Publication types

MeSH terms