. 2014 Dec 22;9(12):e115597.
doi: 10.1371/journal.pone.0115597. eCollection 2014.

Long-term quiescent fibroblast cells transit into senescence

Affiliations

Long-term quiescent fibroblast cells transit into senescence

Shiva Marthandan et al. PLoS One. .

Abstract

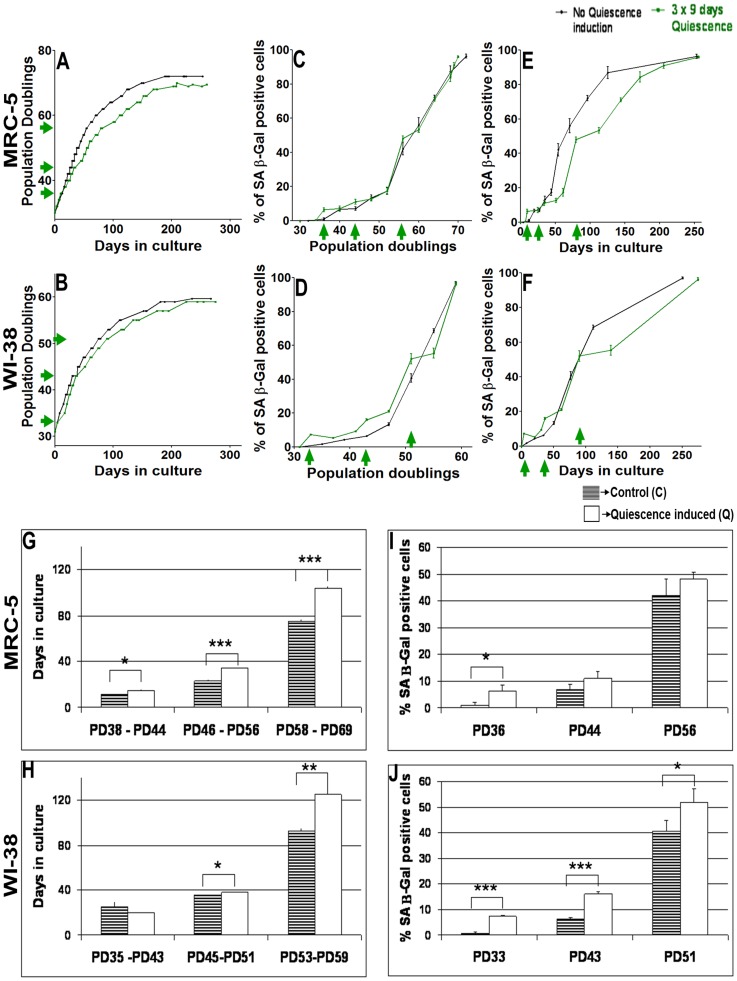
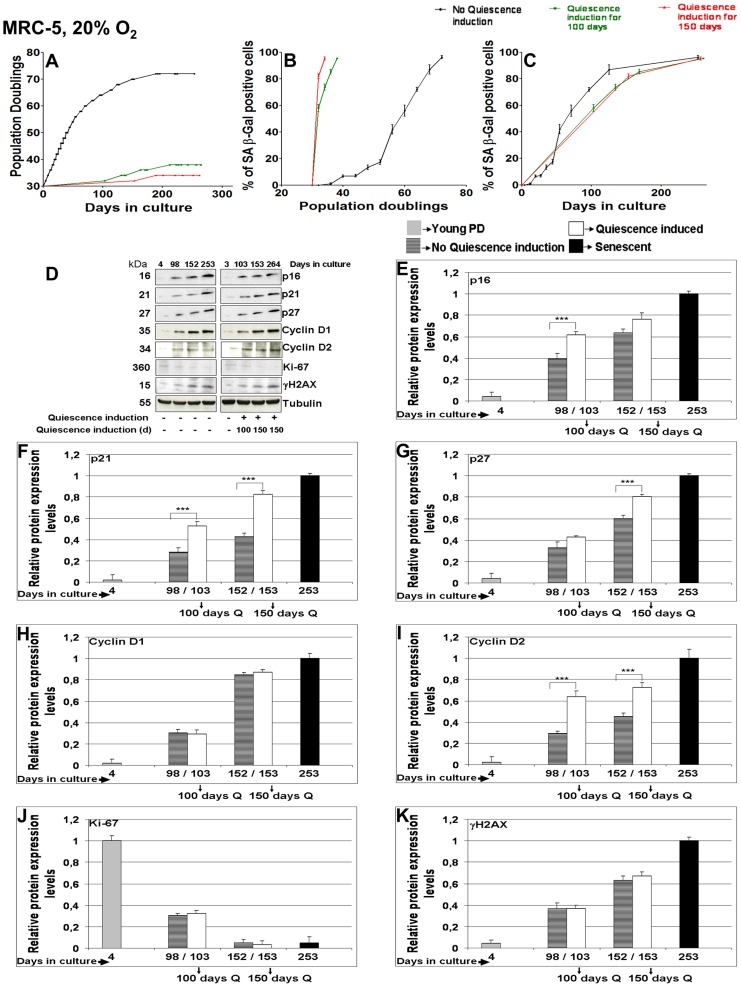
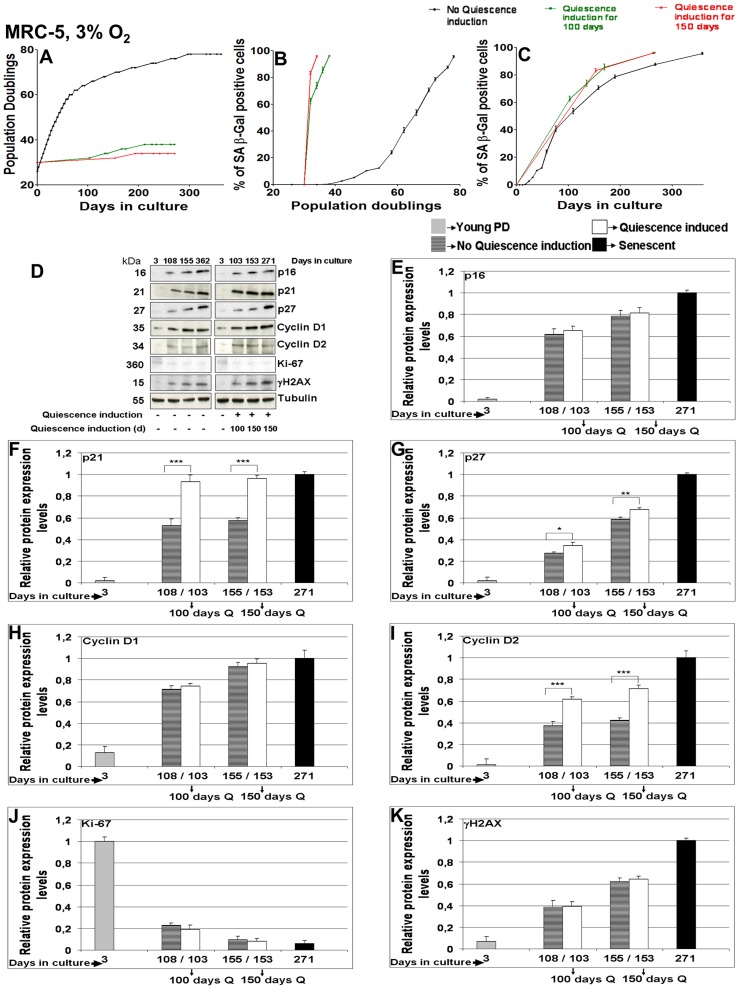
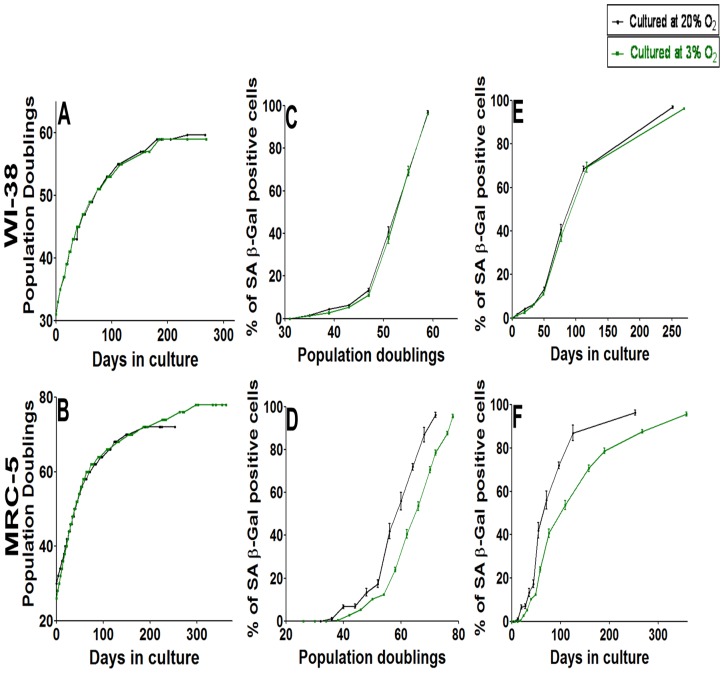
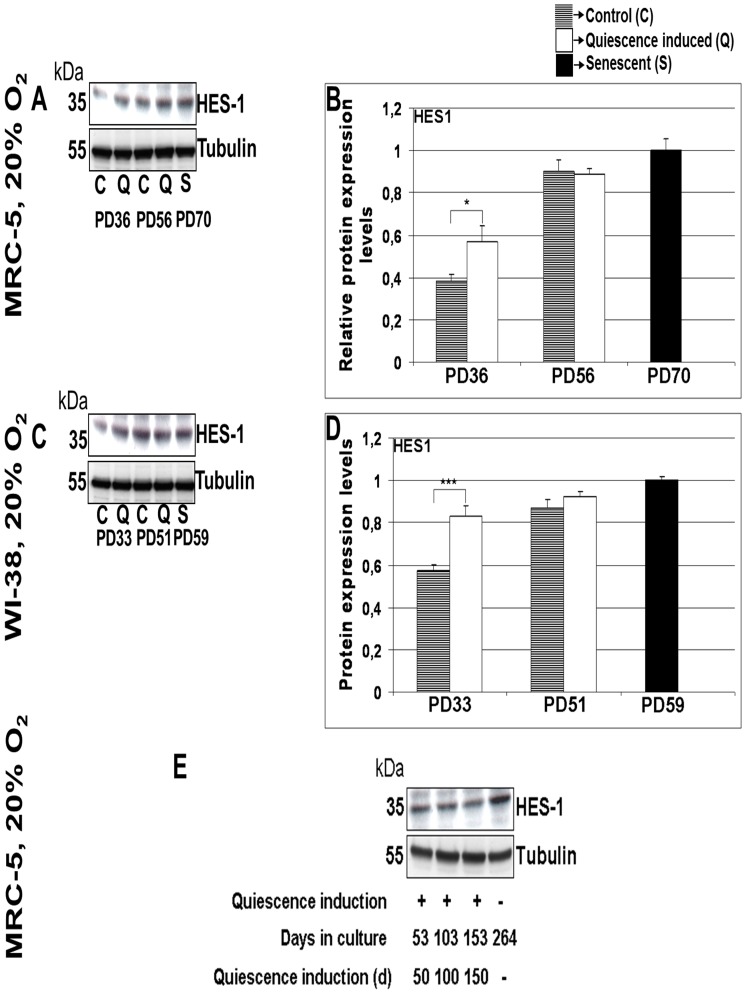
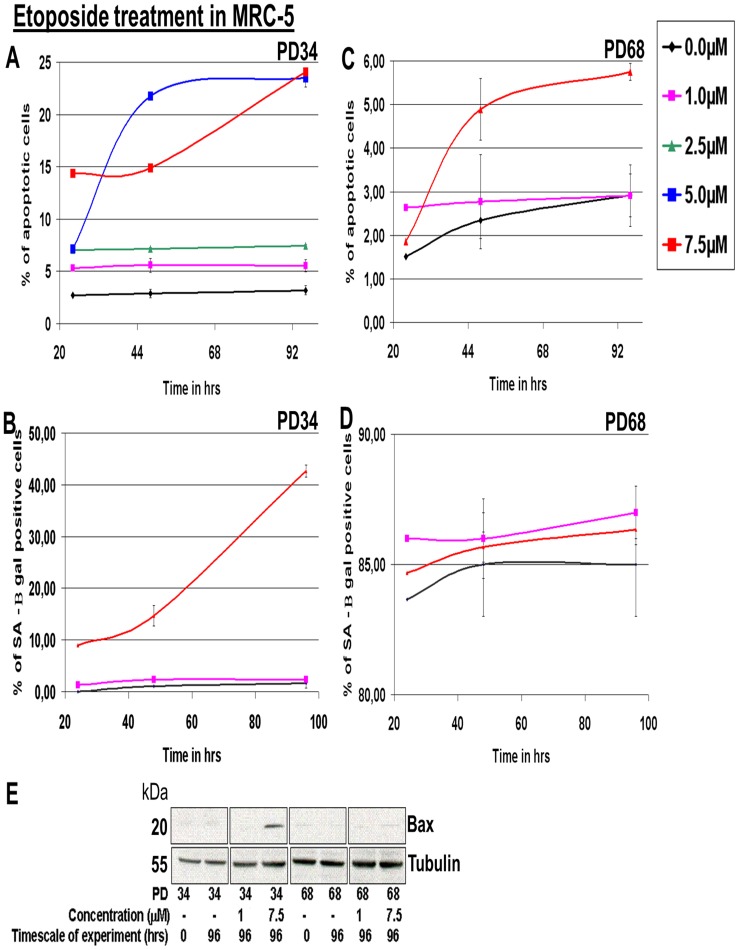
Cellular senescence is described to be a consequence of telomere erosion during the replicative life span of primary human cells. Quiescence should therefore not contribute to cellular aging but rather extend lifespan. Here we tested this hypothesis and demonstrate that cultured long-term quiescent human fibroblasts transit into senescence due to similar cellular mechanisms with similar dynamics and with a similar maximum life span as proliferating controls, even under physiological oxygen conditions. Both, long-term quiescent and senescent fibroblasts almost completely fail to undergo apoptosis. The transition of long-term quiescent fibroblasts into senescence is also independent of HES1 which protects short-term quiescent cells from becoming senescent. Most significantly, DNA damage accumulates during senescence as well as during long-term quiescence at physiological oxygen levels. We suggest that telomere-independent, potentially maintenance driven gradual induction of cellular senescence during quiescence is a counterbalance to tumor development.


Conflict of interest statement

Competing Interests: The authors have declared that no competing interests exist.

Figures

Figure 1
Figure 1. Impact of short term quiescence induction (3×9 days) in MRC-5 and WI-38 fibroblasts.
(A & B) Growth curve of 2 independent MRC-5 (A) and WI-38 (B) fibroblast cell lines (control with no quiescence induction and a cell line where quiescence was induced 3 times separately for a span of 9 days by contact inhibition) maintained in culture at 20% O2 as triplicates from an early PD until senescence at late PDs. Each growth curve is measured in triplicate. Data points of all measurements are displayed (not the mean). (B, C, D, E & F) Percentage of SA-β gal positive cells at different time points of their growth in culture in the control MRC-5 (C & E) and WI-38 (D & F) fibroblast cell line and in the cell line where quiescence was induced 3 times separately. Fig. 1 C and D are plotted with PDs, whereas Fig. 1 E and F are plotted with days in culture in the y-axis. Each curve is measured in triplicate, the mean value is displayed with error bar (± S.E). (G & H) Quiescence was induced by contact inhibition in short periods of 9 days at 3 stages of the lifespan of MRC-5 (at PDs = 36, 44, 56) and WI-38 (at PDs = 33, 43, 51) fibroblasts maintained in culture at 20% O2. The plot shows the number of days spent by MRC-5 (G) and WI-38 (H) fibroblasts in culture between PDs 38 and 44, 46 and 56, and 58 and 69 for MRC-5 (G) and between PDs 35 and 43, 45 and 51, and 53 and 59 for WI-38 (H) for cells having been repeatedly quiescent compared to the control fibroblasts. (I & J) Percentage of SA-β gal positive cells at PD immediately after quiescence induction compared to their respective non-quiescence induced MRC-5 (I) and WI-38 (J) controls. The bars indicate the mean ± S.D. Values statistically different from their controls (t-test) are indicated with an asterix: * p<0.05, ** p<0.01, *** p<0.001. n = 3
Figure 2
Figure 2. Effect of long term quiescence induction (100 or 150 days) in MRC-5 fibroblasts maintained at 20% O2.
(A) Growth curve of 3 independent MRC-5 fibroblast cell lines (control with no quiescence induction, and cell lines where quiescence was induced for 100 or 150 days respectively by contact inhibition and then maintained in culture till they approached senescence) maintained in culture at 20% O2 as triplicates from an early PD until senescence at late PDs. Each growth curve is measured in triplicate. Data points of all measurements are displayed (not the mean). (B & C) Percentage of SA-β gal positive cells at different time points of their growth in culture in the control MRC-5 fibroblast cell line and in the cell lines where quiescence was induced for 100 or 150 days respectively. Fig. 2 B and C are plotted with PDs and days in the y-axis respectively. Each curve is measured in triplicate, the mean value is displayed with error bar (± S.E). (D) The blots show the protein expression levels of p16, p21, p27, Cyclin D1, Cyclin D2, Ki-67 and γH2A.X in MRC-5 fibroblast cell lines (subjected to different culture conditions of 100 or 150 days quiescence by contact inhibition and no quiescence induction) maintained in culture at 20% O2 until they approached senescence at late PD. The up or down-regulation was signified by the presence or absence of the bands in Western Blots. (E, F, G, H, I, J, K) Comparison of mean fold change of protein expression levels of p16 (E), p21 (F), p27 (G), Cyclin D1 (H), Cyclin D2 (I), Ki-67 (J) and γH2A.X (K) in MRC-5 cell lines where quiescence was induced for 100 or 150 days by contact inhibition respectively compared to controls at corresponding span of time in culture. Cell lines were maintained at 20% O2 as triplicates. The bars indicate the mean ± S.D. *** p<0.001 - significantly different compared to fibroblasts with PD assigned 1. n = 3.
Figure 3
Figure 3. Effect of long term quiescence induction (100 or 150 days) in MRC-5 fibroblasts maintained at 3% O2.
(A) Growth curve of 3 independent MRC-5 fibroblast cell lines (control with no quiescence induction, and cell lines where quiescence was induced for 100 or 150 days respectively by contact inhibition and then maintained in culture till they approached senescence) maintained in culture at 3% O2 as triplicates from an early PD until senescence at late PDs. Each growth curve is measured in triplicate. Data points of all measurements are displayed (not the mean). (B & C) Percentage of SA-β gal positive cells at different time points of their growth in culture in the control MRC-5 fibroblast cell line and in the cell lines where quiescence was induced for 100 or 150 days respectively. Fig. 3 B and C are plotted with PDs and days in the y-axis respectively. Each curve is measured in triplicate, the mean value is displayed with error bar (± S.E). (D) The blots show the protein expression levels of p16, p21, p27, Cyclin D1, Cyclin D2, Ki-67 and γH2A.X in MRC-5 fibroblast cell lines (subjected to different culture conditions of 100 or 150 days quiescence by contact inhibition and no quiescence induction) maintained in culture at 3% O2 until they approached senescence at late PD. The up or down-regulation was signified by the presence or absence of the bands in Western Blots. (E, F, G, H, I, J, K) Comparison of mean fold change of protein expression levels of p16 (E), p21 (F), p27 (G), Cyclin D1 (H), Cyclin D2 (I), Ki-67 (J) and γH2A.X (K) in MRC-5 cell lines where quiescence was induced for 100 or 150 days by contact inhibition respectively compared to controls at corresponding span of time in culture. Cell lines were maintained at 3% O2 as triplicates. The bars indicate the mean ± S.D. * p<0.05, ** p<0.01, *** p<0.001 - significantly different compared to fibroblasts with PD assigned 1. n = 3.
Figure 4
Figure 4. Comparison of the effect of O2 levels (3 or 20%) in culture on the growth curve and induction of senescence revealed by β gal in MRC-5 and WI-38 fibroblasts.
(A & B) Growth curve of 2 independent WI-38 (A) and MRC-5 (B) fibroblast cell lines maintained in culture at 20% or 3% O2 till they achieved senescence at late PD. Data points of all measurements are displayed (not the mean). (C & D) Percentage of SA-β gal positive cells at different time points of their growth in culture in WI-38 (C) and MRC-5 (D) fibroblast cell lines maintained at 20% or 3% O2. The figures were plotted with PDs on the x-axis (E & F) Percentage of SA-β gal positive cells at different time points of their growth in culture in WI-38 (E) and MRC-5 (F) fibroblast cell lines maintained at 20% or 3% O2. The figures were plotted with days in culture on the x-axis. Each curve is measured in triplicate, the mean value is displayed with error bar (± S.E). n = 3.
Figure 5
Figure 5. Expression levels of HES1 in MRC-5 and WI-38 fibroblasts subjected to short term or long term quiescence induction.
(A) The blot show the protein expression levels of HES1 in two MRC-5 fibroblast cell lines (control with no quiescence induction and a cell line where quiescence was induced 3 times separately for a span of 9 days) maintained at 20% O2 at different stages of their span in culture. The up or down-regulation was signified by the presence or absence of the bands in Western Blots. (B) Comparison of mean fold change of protein expression levels of HES1 in 3 times quiescence induced MRC-5 cell lines and control MRC-5 cell lines maintained in culture as triplicates. (C) The protein expression levels of HES1 in two WI-38 fibroblast cell lines (control with no quiescence induction and a cell line where quiescence was induced 3 times separately for a span of 9 days) maintained at 20% O2 at different stages of their span in culture. (D) Comparison of mean fold change of protein expression levels of HES1 in 3 times quiescence induced WI-38 cell lines and control WI-38 cell lines maintained in culture as triplicates. The bars indicate the mean ± S.D. * p<0.05, *** p<0.001 - significantly different compared to fibroblasts with PD assigned 1. n = 3 (E) The protein expression levels of HES1 in MRC-5 fibroblast cell lines maintained at 20% subjected to 50, 100 or 150 days of quiescence by contact inhibition and in senescent state. The up or down-regulation was signified by the presence or absence of the bands in Western Blots. n = 2.
Figure 6
Figure 6. Impact of Etoposide treatment in young and old PD MRC-5 fibroblasts.
(A) Percentage of apoptotic cells in MRC-5 fibroblast cell lines (young PD = 34) treated with different concentrations of Etoposide for different time spans (B) Percentage of SA-β gal positive cells in MRC-5 fibroblast cell lines (young PD = 34) treated with different concentrations of Etoposide for different time spans (C) Percentage of apoptotic cells in MRC-5 fibroblast cell lines (old PD = 68) treated with different concentrations of Etoposide for different time spans (D) Percentage of SA-β gal positive cells in MRC-5 fibroblast cell lines (old PD = 68) treated with different concentrations of Etoposide for different time spans. In each instance, MRC-5 fibroblasts were maintained in culture at 20% O2 as triplicates. In A & C, the bars indicate the mean ± S.D. In B & D error bars indicate ± S.E). (E) The blots show absence or induction of apoptotic protein Bax in MRC-5 fibroblast cell lines (young PD = 34 & old PD = 68) treated with 1.0 or 7.5 µM of Etoposide for 96 hrs compared to controls (0 hrs). The MRC-5 fibroblasts were maintained in culture at 20% O2. The up or down-regulation was signified by the presence or absence of the bands in Western Blots. n = 3.

References

    1. Pajalunga D, Mazzola A, Salzano AM, Biferi MG, De Luca G, et al. (2007) Critical requirement for cell cycle inhibitors in sustaining nonproliferative states. Journal of Cell Biology 176:807–818. - PMC - PubMed
    1. Sherr CJ, Roberts JM (1999) CDK inhibitors: positive and negative regulators of G1-phase progression. Genes & Development 13(12):1501–1512. - PubMed
    1. Liu Y, Elf SE, Miyata Y, Sashida G, Liu Y, et al. (2009) p53 Regulates Hematopoietic Stem Cell Quiescence. Cell Stem Cell 4(1):37–48. - PMC - PubMed
    1. van Os R, de Haan G, Dykstra BJ (2009) Hematopoietic Stem Cell Quiescence: Yet another Role for p53. Cell Stem Cell 4(1):7–8. - PubMed
    1. Asai T, Liu Y, Bae N, Nimer SD (2011) The p53 tumor suppressor protein regulates hematopoietic stem cell fate. Journal of Cellular Physiology 226(9):2215–2221. - PMC - PubMed

Publication types

Substances