. 2015 Mar 20;10(3):864-74.
doi: 10.1021/cb500986w. Epub 2015 Jan 6.

Quantitative imaging of glutathione in live cells using a reversible reaction-based ratiometric fluorescent probe

Affiliations

Quantitative imaging of glutathione in live cells using a reversible reaction-based ratiometric fluorescent probe

Xiqian Jiang et al. ACS Chem Biol. .

Abstract

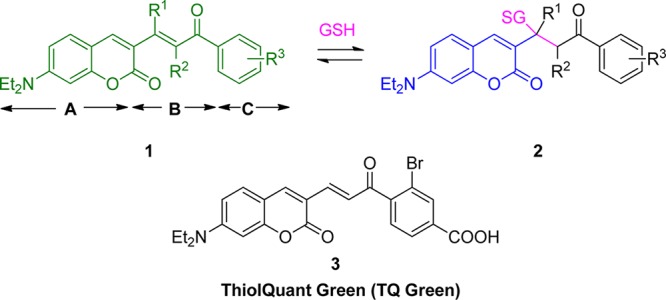
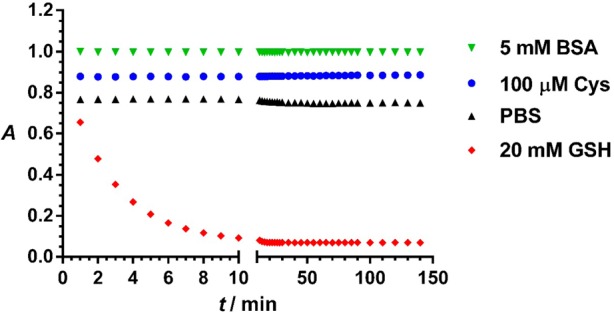
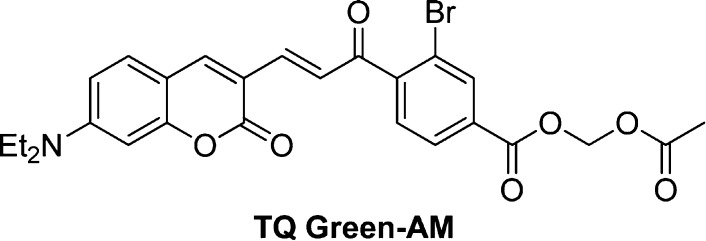
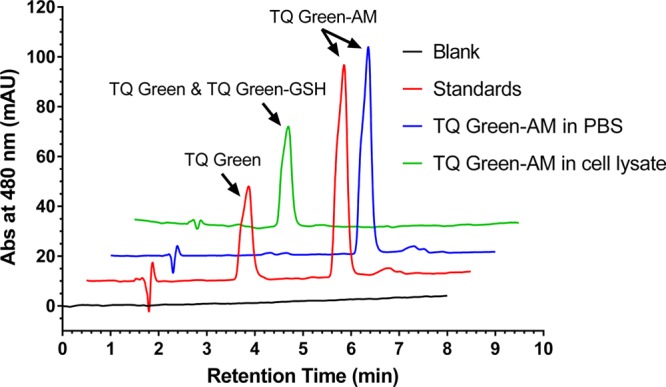
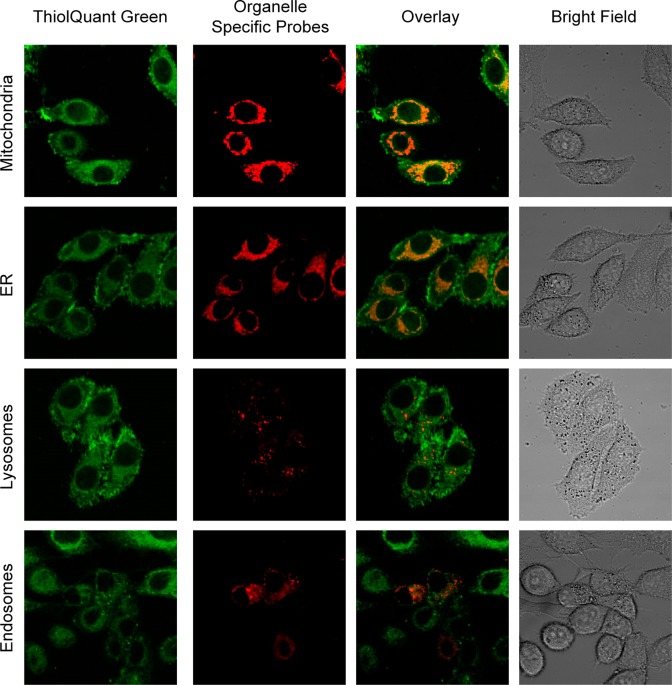
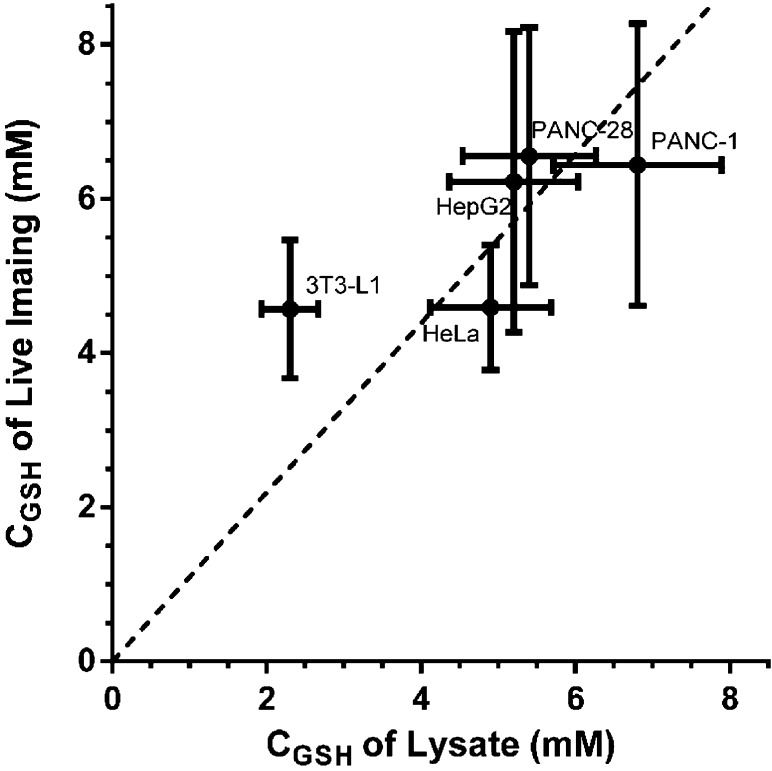
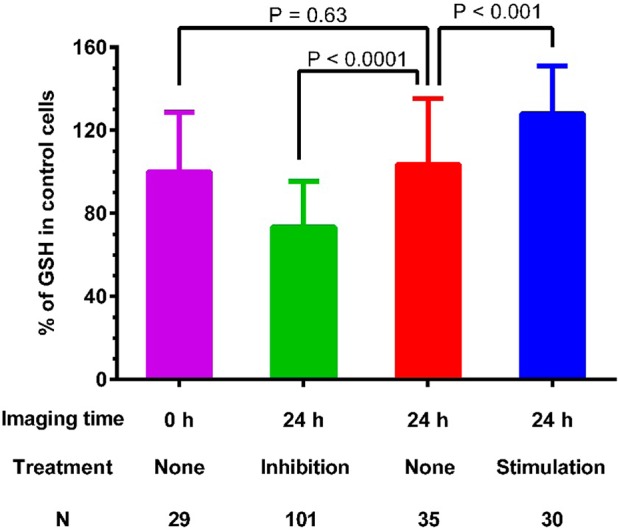
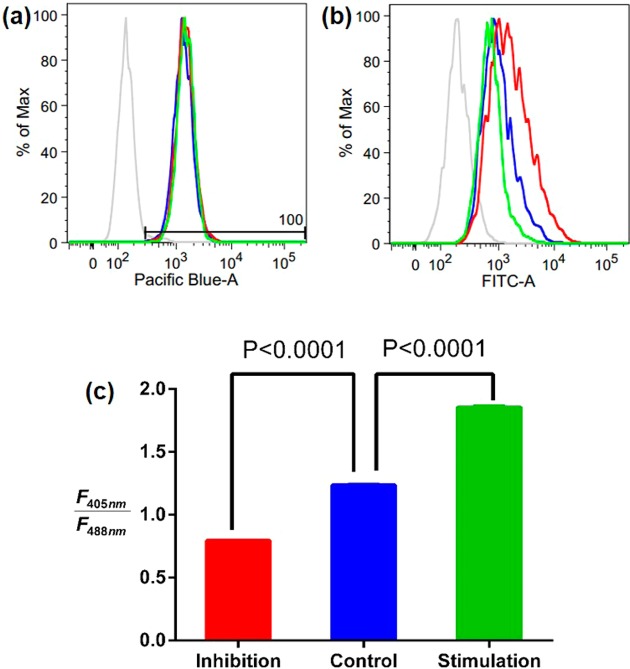
Glutathione (GSH) plays an important role in maintaining redox homeostasis inside cells. Currently, there are no methods available to quantitatively assess the GSH concentration in live cells. Live cell fluorescence imaging revolutionized the field of cell biology and has become an indispensable tool in current biological studies. In order to minimize the disturbance to the biological system in live cell imaging, the probe concentration needs to be significantly lower than the analyte concentration. Because of this, any irreversible reaction-based GSH probe can only provide qualitative results within a short reaction time and will exhibit maximum response regardless of the GSH concentration if the reaction is completed. A reversible reaction-based probe with an appropriate equilibrium constant allows measurement of an analyte at much higher concentrations and, thus, is a prerequisite for GSH quantification inside cells. In this contribution, we report the first fluorescent probe-ThiolQuant Green (TQ Green)-for quantitative imaging of GSH in live cells. Due to the reversible nature of the reaction between the probe and GSH, we are able to quantify mM concentrations of GSH with TQ Green concentrations as low as 20 nM. Furthermore, the GSH concentrations measured using TQ Green in 3T3-L1, HeLa, HepG2, PANC-1, and PANC-28 cells are reproducible and well correlated with the values obtained from cell lysates. TQ Green imaging can also resolve the changes in GSH concentration in PANC-1 cells upon diethylmaleate (DEM) treatment. In addition, TQ Green can be conveniently applied in fluorescence activated cell sorting (FACS) to measure GSH level changes. Through this study, we not only demonstrate the importance of reaction reversibility in designing quantitative reaction-based fluorescent probes but also provide a practical tool to facilitate redox biology studies.


Figures

Scheme 1
Scheme 1. Modular Design of GSH Probes and Structure of TQ Green
Figure 1
Figure 1
UV–vis and fluorescence spectra of TQ Green (λex = 488 nm) and TQ Green-GSH (λex = 405 nm).
Figure 2
Figure 2
Reversibility of the reaction between TQ Green and GSH. (a) Recovery of reacted TQ Green by depleting GSH. (b) Concentration dependent ratiometric spectra of TQ Green in PBS under anaerobic conditions for 18 h. (c) Responsiveness of TQ Green to the concentration changes of GSH. Rmin and Rmax were measured at 0 and 80 mM of GSH, respectively.
Figure 3
Figure 3
Linear relationship between (RRmin)/(RmaxR) and GSH concentration. The reciprocal of the slope is the apparent dissociation constant Kd′. R is based on UV–vis absorption measurements.
Figure 4
Figure 4
Reaction specificity of TQ Green and GSH under physiological concentrations. For clarity, data points for the TQ Green reaction with BSA, cysteine, and PBS were offset by 0.1 unit from each other on the y axis. Data points represent the absorbance of reaction mixtures of TQ Green (32 μM) with cysteine (100 μM, blue), BSA (5 mM, green), GSH (20 mM red), and water (black) in PBS (pH 7.4) at 479 nm, the maximum absorption wavelength for TQ Green.
Scheme 2
Scheme 2. Structure of TQ Green-AM Ester
Figure 5
Figure 5
Regeneration of TQ Green from TQ Green-AM under intracellular environment. TQ Green-AM (40 μM) was incubated in PBS for 2 h and in a 500 times diluted HeLa cell lysate for 10 h at 37 °C. The reaction products were analyzed by HPLC with a tandem of UV–vis and MS detectors. Analytical standards TQ Green and TQ Green-AM (red trace) were used to determine the retention time of the corresponding compounds. TQ Green-AM did not show appreciable hydrolysis in PBS within 2 h (blue trace), indicating that TQ Green-AM stays intact before entering cells under the live imaging conditions. TQ Green-AM was completely hydrolyzed after 10 h of incubation in 500 times diluted cell lysate (green trace), indicating that TQ Green-AM can be completely converted into TQ Green within ∼1 min under an intracellular environment. Note, under the elution conditions used, TQ Green and TQ Green-GSH cannot be separated. But their identities were confirmed by MS. All the traces were offset by 0.5 min on the x axis and 10 mAU on the y axis from each other for clarity.
Figure 6
Figure 6
Subcellular distribution of TQ Green. HeLa cells were costained with TQ Green (green) and different organelle specific probes, including MitoTracker Red, ER-Tracker Red, LysoTracker Red, and mRFP-Rab5 fusion protein (endosome localized red fluorescent protein (RFP)). Orange color in the overlay column indicates colocalization. It should be noted that due to the transfection efficiency, some of the cells did not express mRFP-Rab5.
Figure 7
Figure 7
Measurements of GSH levels in HeLa cells based on ratiometric fluorescence imaging. (a) Representative images of HeLa cells treated with TQ Green-AM. The ratiometric image represents the distribution of GSH levels (the calibration bar represents the ratiometric reading instead of GSH concentration). (b) Standard curve of R, the fluorescence intensity ratio between 405 and 488 nm excitation, as a function of GSH concentration produced using the same instrument setting as the live cell imaging experiment. The data point in red represents the GSH concentration in HeLa cells based on statistical analyses of >40 cells. Error bars represent standard deviations.
Figure 8
Figure 8
Correlation between the GSH concentrations measured in live cells and in lysates. The y axis represents concentrations derived from live imaging, while the x axis represents concentrations determined using cell lysate. All imaging results are from statistical analysis of >40 cells. All assay results are from >3 replicates under the same conditions. Error bars represent standard deviations. The slope of the correlation line (the dash line) is 1.1.
Figure 9
Figure 9
Detection of GSH level changes in PANC-1 cells using TQ Green live imaging. PANC-1 cells were treated with diethyl maleate (50 μM) for 24 and 2 h to inhibit and stimulate GSH levels, respectively. All the cells were imaged 24 h after starting the experiment. Results are statistical analyses of >25 cells. P values shown are based on unpaired student t tests. Error bars represent standard deviations. N is the number of cells analyzed.
Figure 10
Figure 10
Quantification of GSH levels using fluorescence activated cell sorting (FACS). PANC-1 cells were treated with diethyl maleate (50 μM) for 24 and 2 h to inhibit and stimulate GSH levels, respectively. The GSH levels of the cells were measured 24 h after starting the experiment using FACS. Red, green, and blue traces and bars represent inhibition, stimulation, and control conditions. (a,b) Histograms of the 405 nm (Pacific Blue) and 488 nm (FITC) channels are shown. (c) Fluorescence intensity ratios of 405 and 488 nm as a function of treatment conditions. Results are statistical analyses of >4000 cells. P values shown are based on unpaired student t tests. Error bars, representing SEM, are too small to show clearly.

References

    1. Balaban R. S.; Nemoto S.; Finkel T. (2005) Mitochondria, oxidants, and aging. Cell 120, 483–495. - PubMed
    1. Banerjee R. (2012) Redox outside the box: linking extracellular redox remodeling with intracellular redox metabolism. J. Biol. Chem. 287, 4397–4402. - PMC - PubMed
    1. Lomaestro B. M.; Malone M. (1995) Glutathione in health and disease: pharmacotherapeutic issues. Ann. Pharmacother. 29, 1263–1273. - PubMed
    1. Winther J. R.; Thorpe C. (2014) Quantification of thiols and disulfides. Biochim. Biophys. Acta 1840, 838–846. - PMC - PubMed
    1. Yin J.; Kwon Y.; Kim D.; Lee D.; Kim G.; Hu Y.; Ryu J. H.; Yoon J. (2014) Cyanine-based fluorescent probe for highly selective detection of glutathione in cell cultures and live mouse tissues. J. Am. Chem. Soc. 136, 5351–5358. - PubMed

Publication types