

A computational study of stimulus driven epileptic seizure abatement
- PMID: 25531883
- PMCID: PMC4273970
- DOI: 10.1371/journal.pone.0114316
A computational study of stimulus driven epileptic seizure abatement
Abstract
Active brain stimulation to abate epileptic seizures has shown mixed success. In spike-wave (SW) seizures, where the seizure and background state were proposed to coexist, single-pulse stimulations have been suggested to be able to terminate the seizure prematurely. However, several factors can impact success in such a bistable setting. The factors contributing to this have not been fully investigated on a theoretical and mechanistic basis. Our aim is to elucidate mechanisms that influence the success of single-pulse stimulation in noise-induced SW seizures. In this work, we study a neural population model of SW seizures that allows the reconstruction of the basin of attraction of the background activity as a four dimensional geometric object. For the deterministic (noise-free) case, we show how the success of response to stimuli depends on the amplitude and phase of the SW cycle, in addition to the direction of the stimulus in state space. In the case of spontaneous noise-induced seizures, the basin becomes probabilistic introducing some degree of uncertainty to the stimulation outcome while maintaining qualitative features of the noise-free case. Additionally, due to the different time scales involved in SW generation, there is substantial variation between SW cycles, implying that there may not be a fixed set of optimal stimulation parameters for SW seizures. In contrast, the model suggests an adaptive approach to find optimal stimulation parameters patient-specifically, based on real-time estimation of the position in state space. We discuss how the modelling work can be exploited to rationally design a successful stimulation protocol for the abatement of SW seizures using real-time SW detection.
Conflict of interest statement
Figures
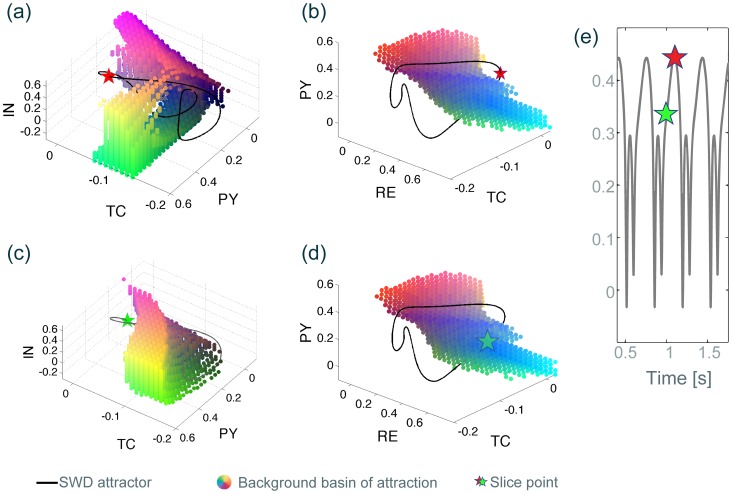
 slices through the four dimensional state space. The slice point in the fourth dimension corresponds a single value of
  on the SWD attractor at time
  (red star) for (a) and
  (green star) for (c). (b) and (d)
 slices with the slice point corresponding to a single value of
  on the SWD attractor at time
  (red star) for (b) and
  (green star) for (d). (e) Corresponding time series showing the slice points. 3D Matlab.fig files are available for (a) and (b) in S1 File & S2 File.
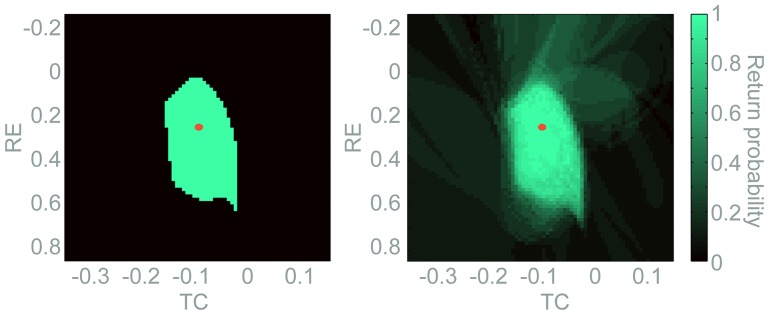
 and
and  are fixed at the value of the background fixed point. Return probabilities (colour code) are scanned in the
  variables. The red dot marks the position of the background fixed point.
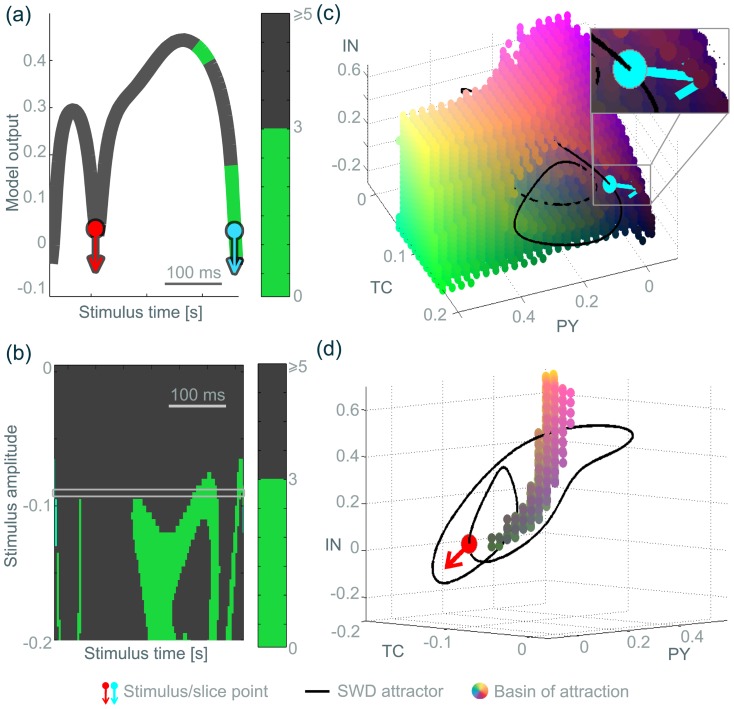
 projection for the stimulation point on the SWD cycle is shown together with the SWD attractor (black line). Blue arrow indicates the successful stimulus at this point, as it points into the basin of attraction. (d) Same as (c). Red arrow indicated the unsuccessful stimulus at this point as it does not point into the basin. Notice the change in axes between (c) and (d), the figures are rotated to aid visualisation, however, the stimulus direction is the same. 3D Matlab.fig files are available for (c) and (d) in S3 File & S4 File.
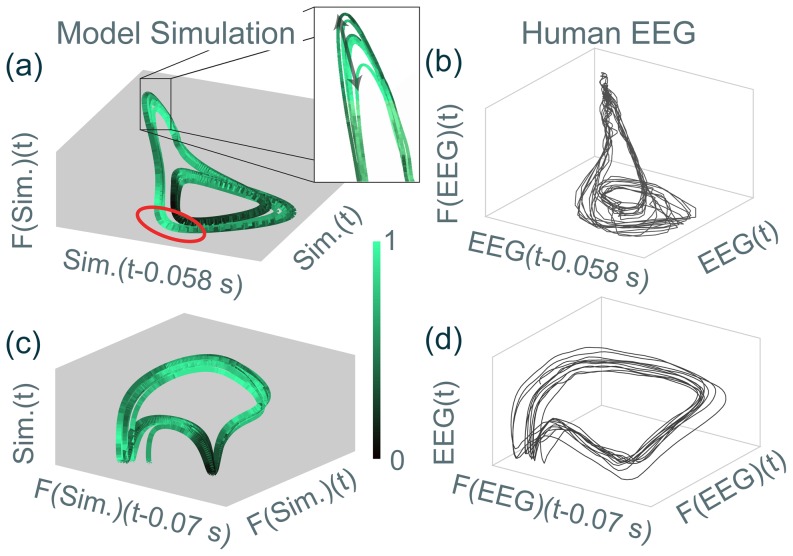
 phase space view (c.f. Fig. 5 (a) rotated). (c, d) Reconstructed attractor corresponding to the
  phase space view (c.f. Fig. 5 (c)). 3D Matlab.fig files are available for all subfigures in S5 File, S6 File, S7 File, & S8 File.
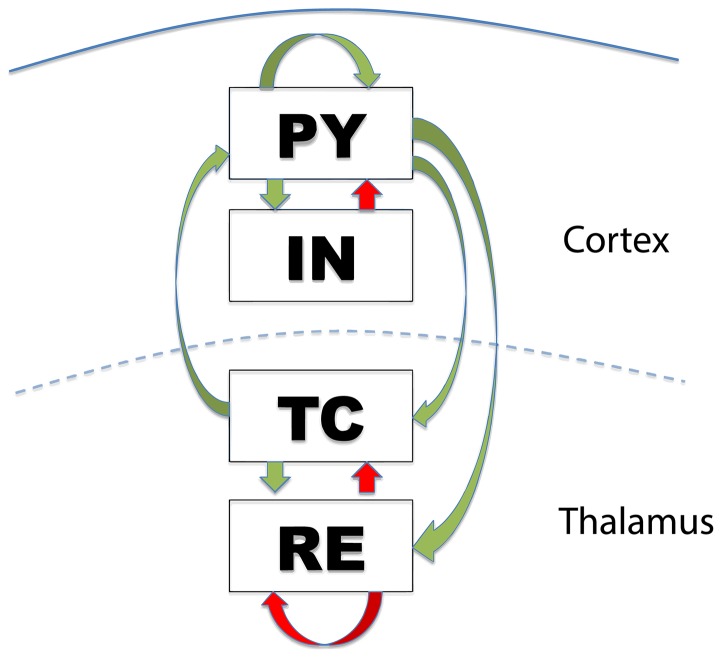
 is the cortical pyramidal neural population,
  is the cortical inhibitory neural population,
  is the thalamocortical neural population, and
  is the thalamic reticular nucleus neural population.
References
-
- Caplan R, Siddarth P, Stahl L, Lanphier E, Vona P, et al. (2008) Childhood absence epilepsy: behavioral, cognitive, and linguistic comorbidities. Epilepsia 49:1838–46. - PubMed
-
- Barnes GN, Paolicchi JM (2008) Neuropsychiatric comorbidities in childhood absence epilepsy. Nat Clin Pract Neurol 4:650–1. - PubMed
-
- Selai C, Bannister D, Trimble M (2005) Antiepileptic drugs and the regulation of mood and quality of life (QOL): the evidence from epilepsy. Epilepsia 46:50–57. - PubMed
-
- Al-Otaibi FA, Hamani C, Lozano AM (2011) Neuromodulation in epilepsy. Neurosurgery 69:957–979. - PubMed
Publication types
MeSH terms
Grants and funding
LinkOut - more resources
Full Text Sources
Other Literature Sources
Medical
Molecular Biology Databases
