. 2015 Apr;137(4):041006.
doi: 10.1115/1.4029430. Epub 2015 Feb 11.

Collagen structure and mechanical properties of the human sclera: analysis for the effects of age

Collagen structure and mechanical properties of the human sclera: analysis for the effects of age

Baptiste Coudrillier et al. J Biomech Eng. 2015 Apr.

Abstract

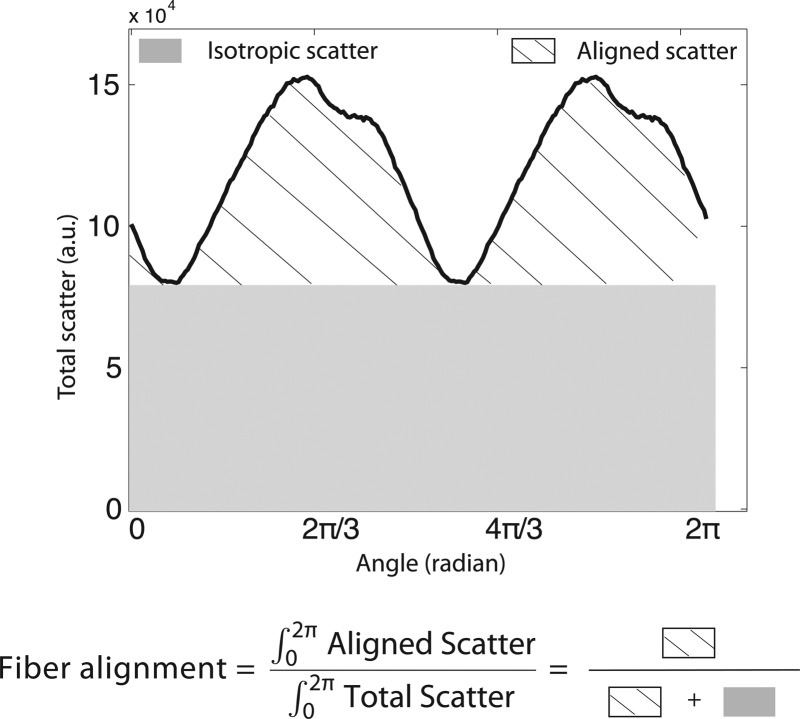
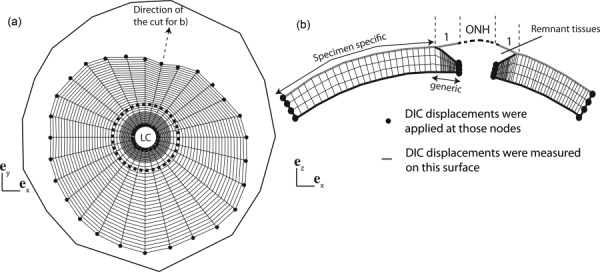
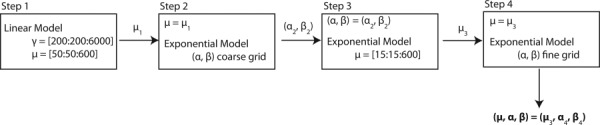
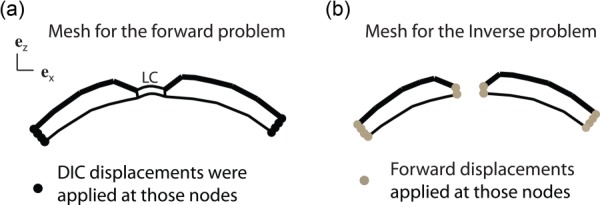
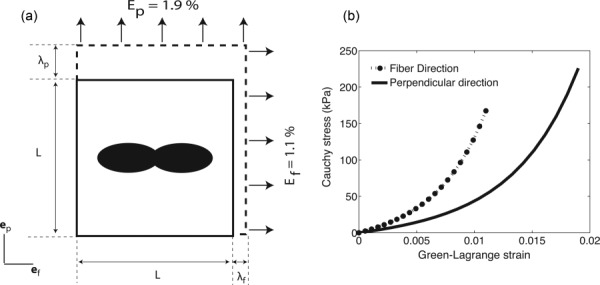
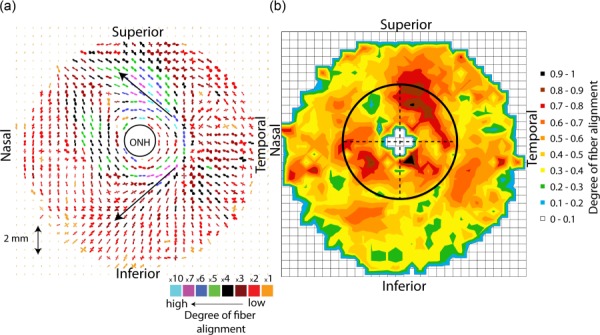
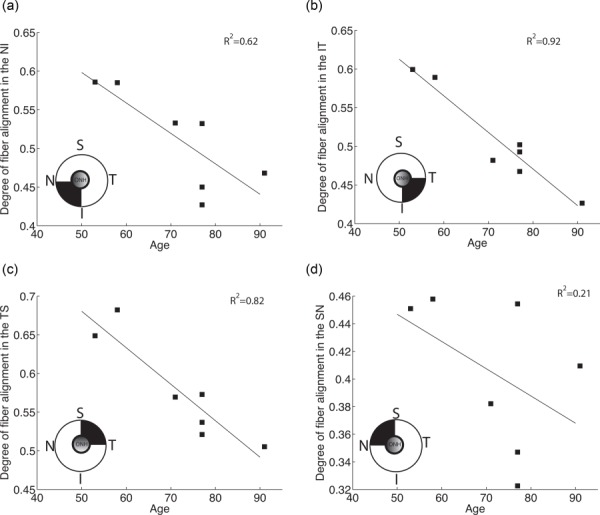
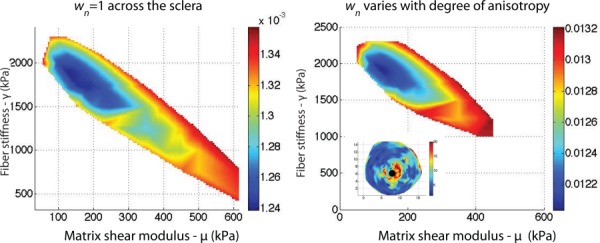
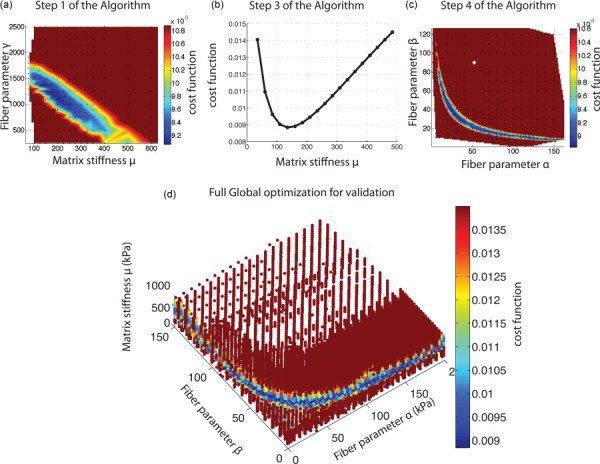
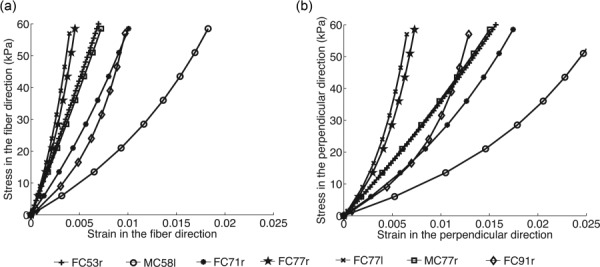
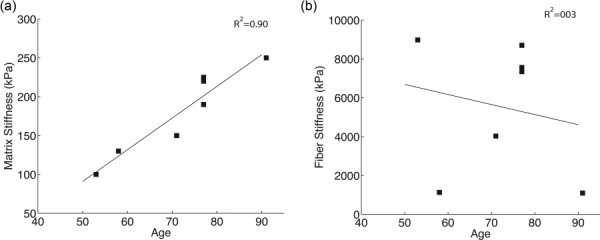
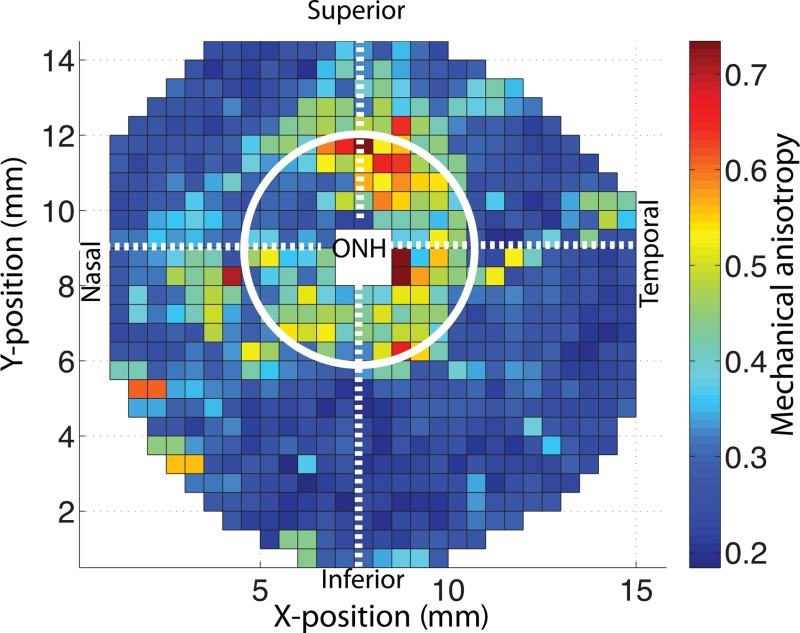
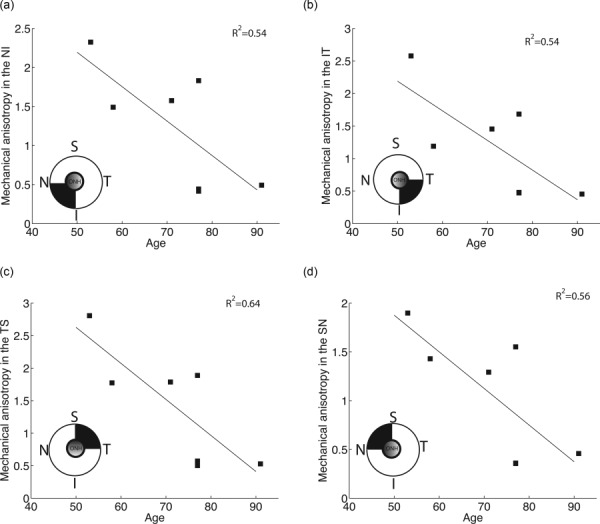
The objective of this study was to measure the collagen fiber structure and estimate the material properties of 7 human donor scleras, from age 53 to 91. The specimens were subjected to inflation testing, and the full-field displacement maps were measured by digital image correlation. After testing, the collagen fiber structure was mapped using wide-angle X-ray scattering. A specimen-specific inverse finite element method was applied to calculate the material properties of the collagen fibers and interfiber matrix by minimizing the difference between the experimental displacements and model predictions. Age effects on the fiber structure and material properties were estimated using multivariate models accounting for spatial autocorrelation. Older age was associated with a larger matrix stiffness (p = 0.001), a lower degree of fiber alignment in the peripapillary sclera (p = 0.01), and a lower mechanical anisotropy in the peripapillary sclera (p = 0.03).


Figures

Fig. 1
Fig. 1
Angular X-ray scatter intensity profile for a WAXS measurement. The total scatter may be separated into that arising from isotropically arranged collagen fibers (shaded region) and that arising from preferentially oriented fibers (hatched region). The degree of fiber alignment was computed as the ratio of the aligned scatter to the total scatter.
Fig. 2
Fig. 2
(a) Top view of the surface layer of the finite element (FE) mesh used for the IFEA, showing the nodes at which DIC-measured displacements were applied as kinematic boundary conditions. The outer line represents the location of the most peripheral pixels of the sclera detected by the DIC software. The dashed circle is the border between the generic and specimen-specific mesh. (b) Schematic of the transverse view of the finite element mesh showing the thickness profile in the generic model of the peripapillary sclera. The LC and the remant tissues were not included in the FE model but are represented for clarity. In the inverse analysis, we assumed that the displacements on the surface of the generic peripapillary model were identical to the DIC-measured displacements on the surface of the remnant tissues. The geometry was discretized using mixed Q1P0 trilinear hexahedral elements, with three elements spanning the thickness. The mesh had 40 nodes in the meridional direction and 28 nodes in the circumferential direction. The node density was larger toward the LC to capture the stress concentration due to the compliant tissue of the ONH.
Fig. 3
Fig. 3
Flow diagram describing the search algorithm for the value of the matrix stiffness μ and fiber parameters (α, β)
Fig. 4
Fig. 4
(a) Finite element model used to validate that the applied kinematic boundary conditions did not overconstrain the solution of the IFEA. In this model, the LC was modeled as a neo-Hookean material, with shear modulus equal to a tenth of that of the sclera. (b) We used the same mesh for the sclera in the inverse method. Forward displacements were applied to the edges of the mesh (base and scleral canal).
Fig. 5
Fig. 5
(a) Representation of the single element used to calculate the MA. The fiber structure was described using a single WAXS measurement. A biaxial stretch corresponding to the average strain measured in Coudrillier et al. [18] was applied on the ef and ep faces. (b) Representation of the Green–Lagrange strain/Cauchy stress response. The MA was calculated using Eq. (9).
Fig. 6
Fig. 6
(a) A composite polar plot showing the preferred orientations of aligned collagen fibers for the specimen FC53r. The color scale conveys the degree of fiber alignment. FC53r was representative of the other specimens, showing a strong circumferential fiber alignment in the peripapillary sclera, a much more isotropic midposterior sclera, and two symmetrical oblique features emerging from the temporal pole of the peripheral peripapillary sclera, indicated with arrows. (b) Contour map of calculated degree of fiber alignment, defined as the ratio of the aligned scatter to the total scatter as shown in Fig. 1. The degree of fiber alignment was largest in the temporal/superior quadrant and lowest in the superior/nasal quadrant of the peripapillary sclera.
Fig. 7
Fig. 7
Degree of fiber alignment averaged over each quadrant. Age was associated with a significant decrease in mean degree of fiber alignment (p = 0.01).
Fig. 8
Fig. 8
(a) Contour of the cost function in the (μ, γ)-space with wn = 1 for each node (Eq. (2)). (b) Contour of the cost function in the (μ, γ)-space with wn chosen to reflect the degree of anisotropy of the closest WAXS measurement. The weights are represented in the figure on the bottom left. The contribution of the nodes of the peripapillary sclera to the cost function was larger than those of the midposterior sclera. The cost function is represented between its minimum value m and 1.1 m.
Fig. 9
Fig. 9
(a) Step 1, (b) step 3, and (c) step 4 of the sequential algorithm as shown in Fig. 3 and explained in Sec. 2.6. (d) Map of cost function for a dense 3D grid. We evaluated 21,519 combinations of material parameters (α, β, μ), with 0 < α < 200 kPa, 0 < β < 150, and 30 < μ < 1000 kPa. Although hard to see in this figure, the global search algorithm confirmed that the restriction for μ obtained in our sequential algorithm was accurate.
Fig. 10
Fig. 10
Stress–strain curves in the fiber (a) and perpendicular (b) directions obtained from an equibiaxial stress to 60 kPa, corresponding to the hoop stress in a thin-walled sphere of radius 12 mm and thickness 1.2 mm at a pressure of 90 mm Hg. The fiber structure was represented by a von Mises function, which was fit to the specimen-specific averaged fiber distribution in the peripapillary sclera.
Fig. 11
Fig. 11
(a) Matrix shear modulus μ and (b) fiber stiffness 4αβ plotted versus age
Fig. 12
Fig. 12
Map of the MA defined in Eq. (9) for FC77r. The MA was largest in the temporal/superior quadrant of the peripapillary sclera and lowest in the superior/nasal quadrant of the peripapillary sclera.
Fig. 13
Fig. 13
Average MA in each quadrant of the peripapillary sclera plotted versus age

References

    1. Watson, P. G. , and Young, R. D. , 2004, “Scleral Structure, Organisation and Disease. A Review,” Exp. Eye Res., 78(3), pp. 609–623.10.1016/S0014-4835(03)00212-4 - DOI - PubMed
    1. Keeley, F. , Morin, J. , and Vesely, S. , 1984, “Characterization of Collagen From Normal Human Sclera,” Exp. Eye Res., 39(5), pp. 533–542.10.1016/0014-4835(84)90053-8 - DOI - PubMed
    1. Komai, Y. , and Ushiki, T. , 1991, “The Three-Dimensional Organization of Collagen Fibrils in the Human Cornea and Sclera,” Invest. Ophthalmol. Visual Sci., 32(8), pp. 2244–2258. - PubMed
    1. Kokott, W. , 1934, “Das spaltlinienbild der sklera. (ein beitrag zum funktionellen bau der sklera),” Klin. Monatsbl. Augenheilkd, 92, pp. 177–185.
    1. Meek, K. , and Fullwood, N. J. , 2001, “Corneal and Scleral Collagens-A Microscopist's Perspective,” Micron, 32(3), pp. 261–272.10.1016/S0968-4328(00)00041-X - DOI - PubMed

Publication types