. 2015 Apr;62(4):1179-84.
doi: 10.1109/TBME.2014.2381002.

Ultrasound elasticity imaging for determining the mechanical properties of human posterior tibial tendon: a cadaveric study

Ultrasound elasticity imaging for determining the mechanical properties of human posterior tibial tendon: a cadaveric study

Liang Gao et al. IEEE Trans Biomed Eng. 2015 Apr.

Abstract

Posterior tibial tendon dysfunction (PTTD) is a common degenerative condition leading to a severe impairment of gait. There is currently no effective method to determine whether a patient with advanced PTTD would benefit from several months of bracing and physical therapy or ultimately require surgery. Tendon degeneration is closely associated with irreversible degradation of its collagen structure, leading to changes to its mechanical properties. If these properties could be monitored in vivo, they could be used to quantify the severity of tendonosis and help determine the appropriate treatment. The goal of this cadaveric study was, therefore, to develop and validate ultrasound elasticity imaging (UEI) as a potentially noninvasive technique for quantifying tendon mechanical properties. Five human cadaver feet were mounted in a materials testing system (MTS), while the posterior tibial tendon (PTT) was attached to a force actuator. A portable ultrasound scanner collected 2-D data during loading cycles. Young's modulus was calculated from the strain, loading force, and cross-sectional area of the PTT. Average Young's modulus for the five tendons was (0.45 ± 0.16 GPa) using UEI, which was consistent with simultaneous measurements made by the MTS across the whole tendon (0.52 ± 0.18 GPa). We also calculated the scaling factor (0.12 ± 0.01) between the load on the PTT and the inversion force at the forefoot, a measurable quantity in vivo. This study suggests that UEI could be a reliable in vivo technique for estimating the mechanical properties of the PTT, and as a clinical tool, help guide treatment decisions for advanced PTTD and other tendinopathies.


Figures

Fig. 1
Fig. 1
(Left) Photograph of the experimental setup, including the MTS and the 14-MHz hockey stick linear array (“A”). The monitor displays a B-mode image of the PTT. The primary load cell (“LC01”) measured the load force (“F”) applied to the tendon, while a secondary load cell (“LC02”) measured the inversion force. (Right) Closer view from a reverse angle displaying imaging side of the foot. The primary load cell (“LC01”) pulled the PTT proximally via a steel cable. The yellow arrows denote the direction of pulling while loading. The foot was potted in a Cerrobend pot (“Pot”) using the fibula and tibia (“B”). The red line near the ankle marks the standard position of the ultrasound probe over the PTT.
Fig. 2
Fig. 2
UEI displacement and strain of the PTT during a representative loading–unloading cycle. (Left column, from top) B-mode image with PTT between two red dotted lines, longitudinal (x) displacement, longitudinal strain, transverse (y) displacement, and transverse strain over small regions (1.5 × 0.5 mm). The green scale bar in the image = 5 mm. (Right column, from top) Force measured at the proximal end of the PTT by the primary load cell, longitudinal displacement (Disp.), longitudinal strain, transverse displacement, and transverse strain in the region enclosed by the red box in the left column.
Fig. 3
Fig. 3
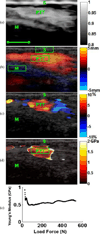
(a) 2-D Map of the speckle tracking correlation coefficient (average over one cycle). Green scale bar = 5 mm, S = Skin, M= Malleolus. (b) Longitudinal displacement map. The three boxes denote the ROIs used to calculate the displacement within and outside the tendon. (c) Strain map at a near maximal load (550 N) superimposed on the B-mode image (gray). (d) Image of Young’s modulus in tendon above malleolus. The discontinuity in the strain map was due to out-of-plane motion of the PTT as it turned around the ankle joint. This was more evident in the B-mode movies. (e) Young’s modulus versus loading force, averaged over the green box in (d).
Fig. 4
Fig. 4
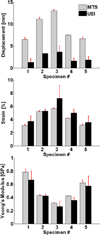
Comparison of longitudinal displacement (Top), strain (Middle), and Young’s modulus (Bottom) using MTS (gray, entire tendon) and UEI (black, localized region). All values were calculated at 550 N. The red error bar denotes standard deviation (SD), which was calculated for each specimen over three trials. The displacement for the MTS was much larger than UEI because the MTS measurement occurred across the entire tendon rather than just the local region above the malleolus. Nevertheless, there was a high correlation between UEI and MTS for displacement (R2 = 0.95), strain (R2 = 0.88), and Young’s modulus (R2 = 0.96) for the five specimens.
Fig. 5
Fig. 5
Comparison between video tracking and UEI for measuring strain for the same tendon at supramalleolar location. (Top Left) Photograph of top surface of tendon with fudicial ink markers placed for optical tracking. (Bottom Left) Ultrasound image at the same location, green bar = 5 mm. (Right). Strain measured at the surface of the PTT using video (black) and within the PTT using UEI (red). The average strain for UEI was computed over the red box in the B-mode image. The mean difference between the two strain curves was 0.11 ± 0.03%.
Fig. 6
Fig. 6
Relationship between applied load and inversion force for five PTTs. This plot includes results for three trials for each of the samples. The average slope is 0.12 ± 0.01 with R2 = 0.999.

References

    1. Kohls-Gatzoulis J, et al. The prevalence of symptomatic posterior tibialis tendon dysfunction in women over the age of 40 in England. Foot Ankle Surg. 2009;15(2):75–81. - PubMed
    1. Petersen W, et al. The blood supply of the posterior tibial tendon. J. Bone Joint Surg. Brit. 2002;84(1):141–144. - PubMed
    1. Pomeroy GC, et al. Acquired flatfoot in adults due to dysfunction of the posterior tibial tendon. J. Bone Joint Surg. Amer. 1999;81(8):1173–1182. - PubMed
    1. Maganaris CN, Paul JP. In vivo human tendon mechanical properties. J. Physiol. 1999;521:307–313. - PMC - PubMed
    1. Lichtwark GA, Wilson AM. In vivo mechanical properties of the human Achilles tendon during one-legged hopping. J. Exp. Biol. 2005;208:4715–4725. - PubMed

Publication types