. 2015 Mar;14(3):484-98.
doi: 10.1074/mcp.M114.043836. Epub 2014 Dec 22.

Integrating phosphoproteome and transcriptome reveals new determinants of macrophage multinucleation

Affiliations

Integrating phosphoproteome and transcriptome reveals new determinants of macrophage multinucleation

Maxime Rotival et al. Mol Cell Proteomics. 2015 Mar.

Abstract

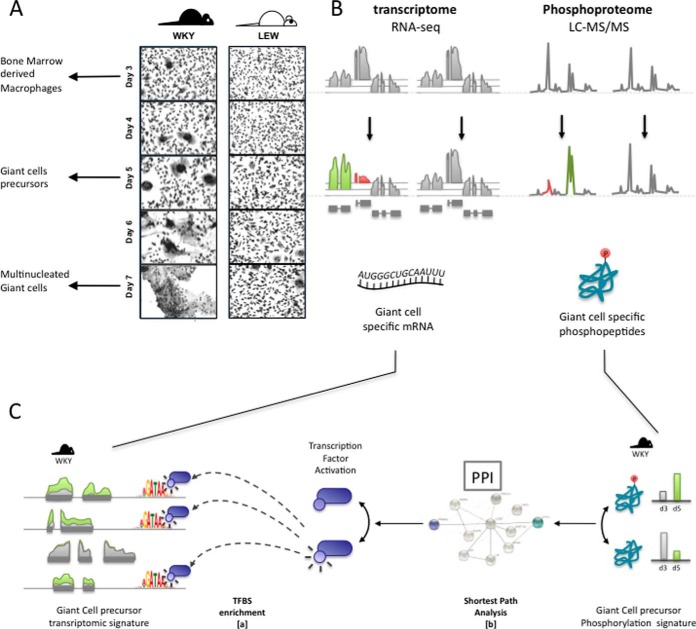
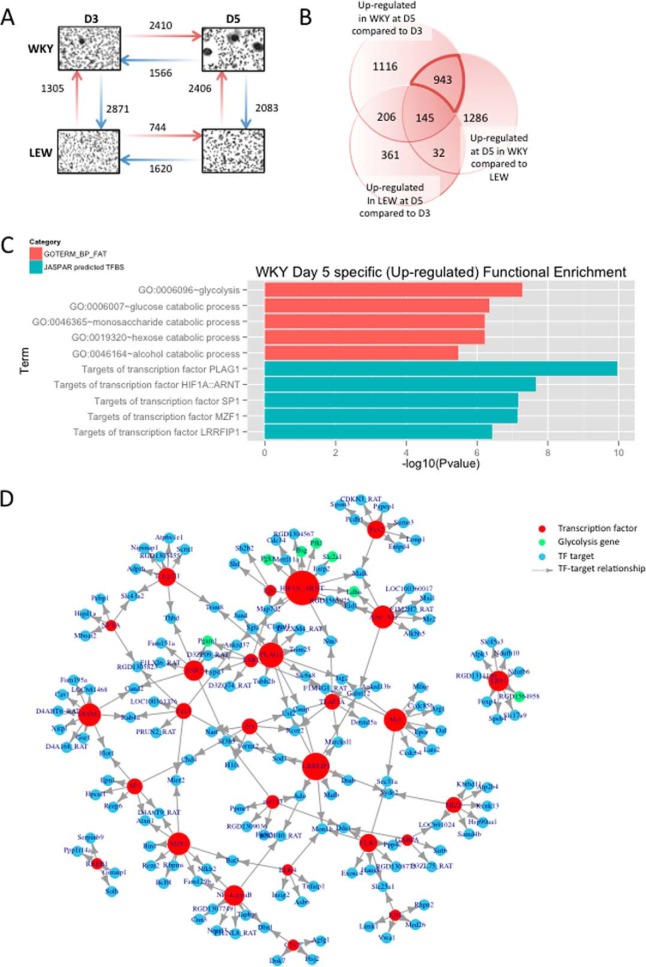
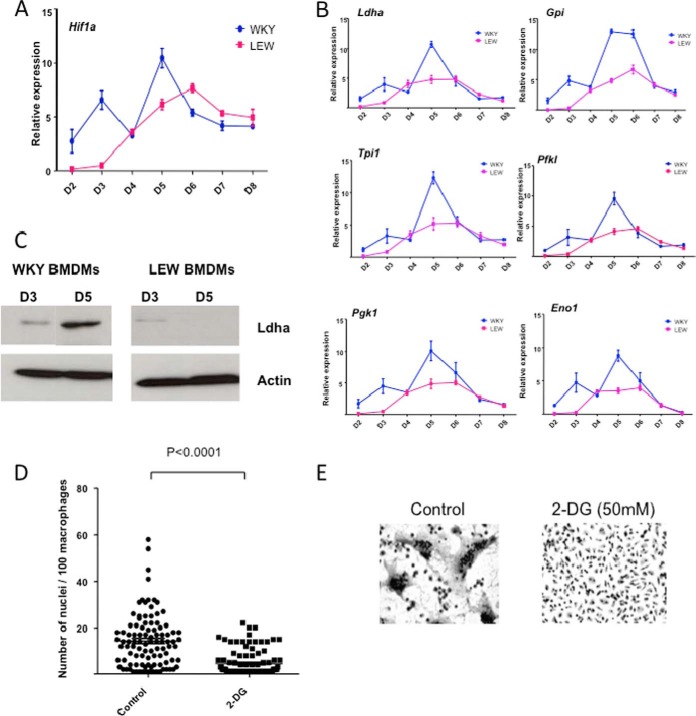
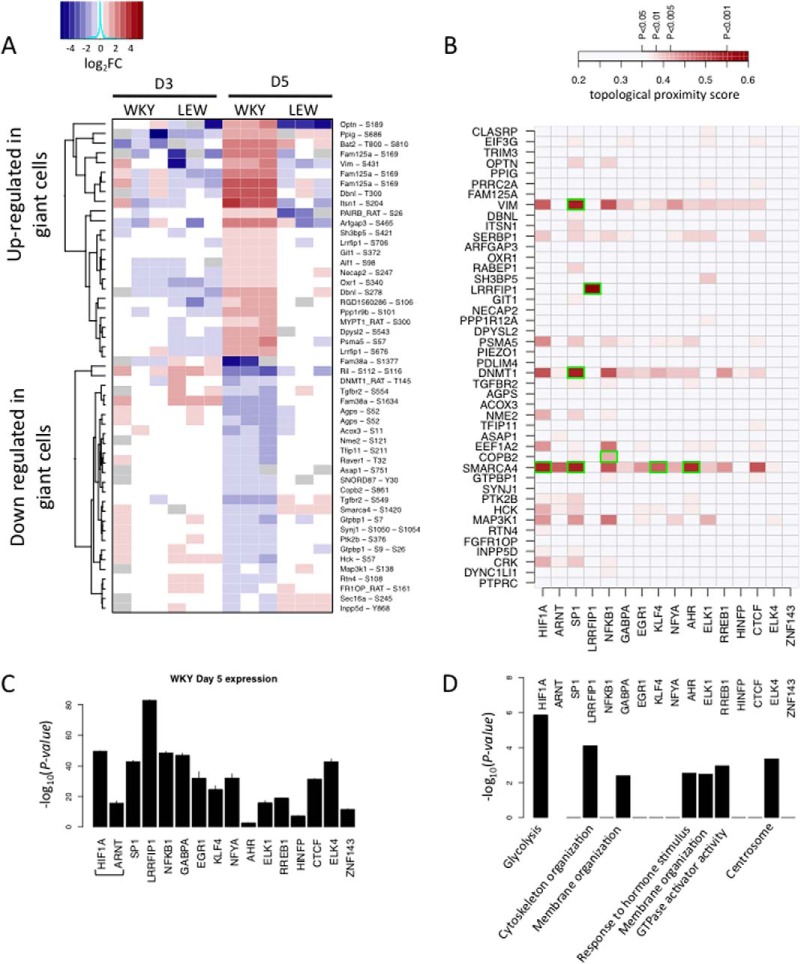
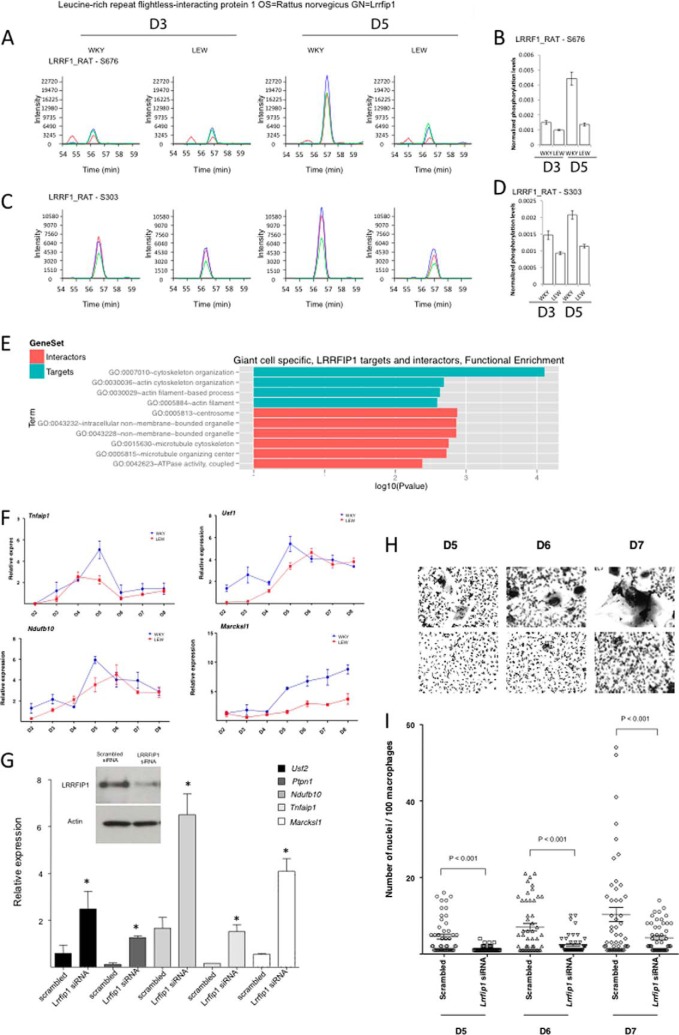
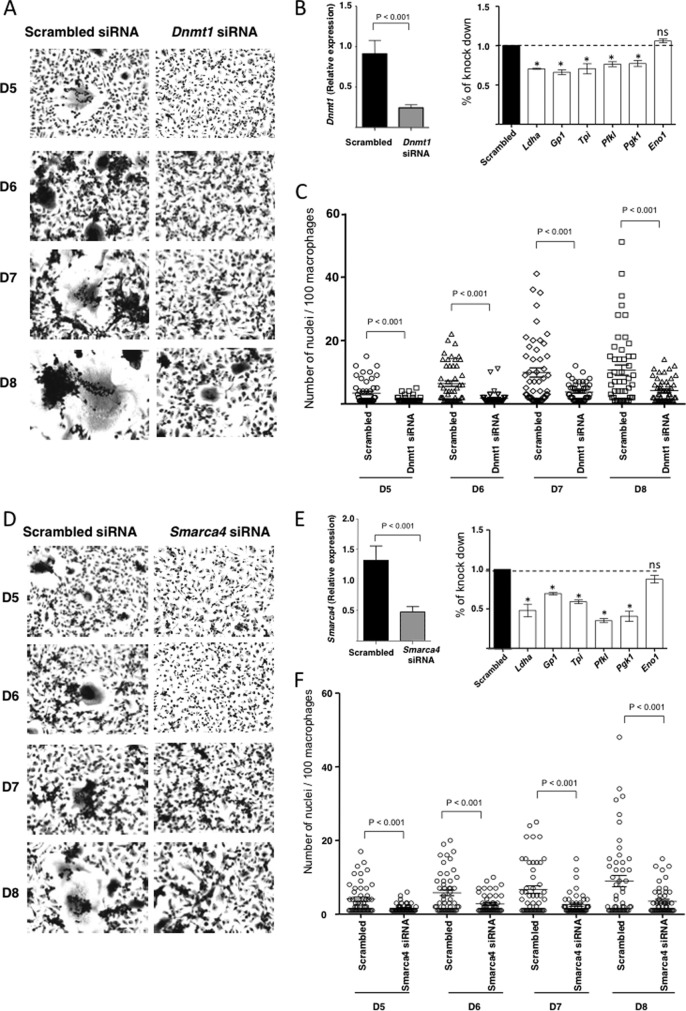
Macrophage multinucleation (MM) is essential for various biological processes such as osteoclast-mediated bone resorption and multinucleated giant cell-associated inflammatory reactions. Here we study the molecular pathways underlying multinucleation in the rat through an integrative approach combining MS-based quantitative phosphoproteomics (LC-MS/MS) and transcriptome (high-throughput RNA-sequencing) to identify new regulators of MM. We show that a strong metabolic shift toward HIF1-mediated glycolysis occurs at transcriptomic level during MM, together with modifications in phosphorylation of over 50 proteins including several ARF GTPase activators and polyphosphate inositol phosphatases. We use shortest-path analysis to link differential phosphorylation with the transcriptomic reprogramming of macrophages and identify LRRFIP1, SMARCA4, and DNMT1 as novel regulators of MM. We experimentally validate these predictions by showing that knock-down of these latter reduce macrophage multinucleation. These results provide a new framework for the combined analysis of transcriptional and post-translational changes during macrophage multinucleation, prioritizing essential genes, and revealing the sequential events leading to the multinucleation of macrophages.


Conflict of interest statement

Conflict of interest: The authors declare that they have no conflict of interest.

Figures

Fig. 1.
Fig. 1.
Analysis pipeline. Primary macrophages from WKY and LEW are derived from the bone marrow after 3 day of culture and show a marked phenotypic difference in multinucleation and MGC formation, A. To understand the determinants of spontaneous macrophage multinucleation, we measure the macrophage transcriptome and phospho-proteome at day 3 (mononuclear and differentiated BMDMs) and in MGC precursors (day 5). MGC precursor-specific molecular signatures are next identified by determining transcriptional changes unique to WKY day 5 BMDMs B, and by characterizing multinucleation-specific transcription factors through transcription factor binding site enrichment analysis (C, step a). Finally, multinucleation-specific transcription factors and phosphopeptides are integrated by identifying pairs in closer than random vicinity in the protein interaction network (C, step b).
Fig. 2.
Fig. 2.
Transcriptomic signature of macrophage multinucleation uncovers a role of HIF1-mediated glycolysis in MGCs. A, The number of up (red arrow) and down (blue arrow) regulated transcripts between each pair of condition (strain of rat and time of culture). B, the overlap of genes up-regulated at D5 in both strains and genes up-regulated in WKY at D5 and and highlighting of 943 MGC precursor specific genes. C, GO and TFBS enrichment for the set of MGC specific genes. D, the network of TF found in the enrichment analysis (red) with MGC specific genes that among their top 200 predicted targets (blue). Node size reflects number of neighbors. Glycolysis genes and are highlighted in green. E, transcript level expression of the top 3 TF found in the Enrichment analysis.
Fig. 3.
Fig. 3.
HIF1 mediated glycolysis is essential for macrophage multinucleation. A, expression of HIF1a in macrophages from WKY and LEW across time points. B, expression of HIF1a targets Ldha, Gpi, Tpi1, Pfkl, Pgk1, and Eno1 in macrophages from WKY and LEW and across time points. C, Western blot of Ldha at day 3 and day 5 in WKY and LEW, respectively. D and E, the effect of 2 Deoxy glucose treatment on multinucleation of WKY BMDMs.
Fig. 4.
Fig. 4.
Phosphoproteome reprogramming and prediction of new regulators of MGC transcriptomic reprogramming via shortest path analysis. A, the heatmap of phosphopeptide expression across all conditions for the set of peptides harboring MGC specific phosphorylation pattern. For each phospho-peptides, abundance is shown relative to the median across all samples and in log2 scale. Gray spots represent missing quantification of the peptide. B, topological proximity score between MGC specific phospho-peptides and transcription factors, based on 10-shortest path analysis. Stronger color indicates higher topological proximity in the protein–protein interaction network. Only the scores that are significant at a 5% nominal p value are displayed (pairs among the top 5% closest pairs of the PPI network). MGC specific phosphoprotein-transcription factors pairs that have a direct connection in the PPI network are highlighted in green. C, expression (FPKM) of transcription factors with over-represented targets among MGC specific transcripts. D, the strongest over-represented Gene Ontology among the targets of each transcription factor. Bar height reflects -log10 p values of enrichment.
Fig. 5.
Fig. 5.
LRRFIP1, a new regulator of MGC formation. A and C, extracted ion chromatograms of the two LRRFIP1 phosphopeptides exhibiting differential phosphorylation across time points in both strains. On each graph the blue, green and red curve show the intensity of the three main isotopic peaks. B and D, show the associated quantification of normalized phosphoprotein abundance. E, represents GO enrichment of LRRFIP1 direct interactors (salmon) and predicted targets specifically up-regulated in MGC (turquoise). F, shows the expression of LRRFIP1 predicted targets over time in both WKY and LEW during multinucleation. G, the effect of LRRFIP1 knockdown on its predicted targets. H, and I highlight the role of LRRFIP1 in macrophage fusion by showing the reduction of macrophage multinucleation following LRRFIP1 Knock down.
Fig. 6.
Fig. 6.
Effect of DNMT1 and SMARCA4 knock-down on glycolysis and multinucleation. A, B, and C, show the effect of siRNA knock down of DNMT1 on multinucleation and glycolysis in WKY macrophages. A comparison of cell cultures over time and quantifications of multinucleation are shown in A and C. B, the effect of knock down of DNMT1 on glylotyic gene expression at day 5. D, E, and F, show the effect of siRNA knock down of SMARCA4 on multinucleation and glycolysis in WKY macrophages. A comparison of cell cultures over time and quantifications of multinucleation are shown in D and F. C shows the effect of knock down of SMARCA4 on glylotyic gene expression at day 5.

References

    1. Teitelbaum S. L. (2000) Bone resorption by osteoclasts. Science 289, 1504–1508 - PubMed
    1. Tonna E. A. (1963) Origin of osteoclats from the fusion of phagocytes. Nature 200, 226–227 - PubMed
    1. Brodbeck W. G., Anderson J. M. (2009) Giant cell formation and function. Curr. Opin. Hematol. 16, 53–57 - PMC - PubMed
    1. Van Maarsseveen T. C. M. T., Vos W., van Diest P. J. (2009) Giant cell formation in sarcoidosis: cell fusion or proliferation with nondivision? Clin. Exp. Immunol. 155, 476–486 - PMC - PubMed
    1. Helming L., Gordon S. (2009) Molecular mediators of macrophage fusion. Trends Cell Biol. 19, 514–522 - PubMed

Publication types

MeSH terms