. 2014 Dec 23;15(1):1166.
doi: 10.1186/1471-2164-15-1166.

Fine mapping of Rcr1 and analyses of its effect on transcriptome patterns during infection by Plasmodiophora brassicae

Affiliations

Fine mapping of Rcr1 and analyses of its effect on transcriptome patterns during infection by Plasmodiophora brassicae

Mingguang Chu et al. BMC Genomics. .

Abstract

Background: The protist Plasmodiophora brassicae is a biotrophic soil-borne pathogen that causes clubroot on Brassica crops worldwide. Clubroot disease is a serious threat to the 8 M ha of canola (Brassica napus) grown annually in western Canada. While host resistance is the key to clubroot management, sources of resistance are limited.

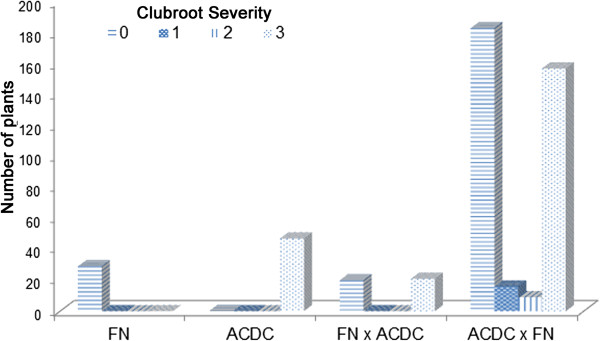
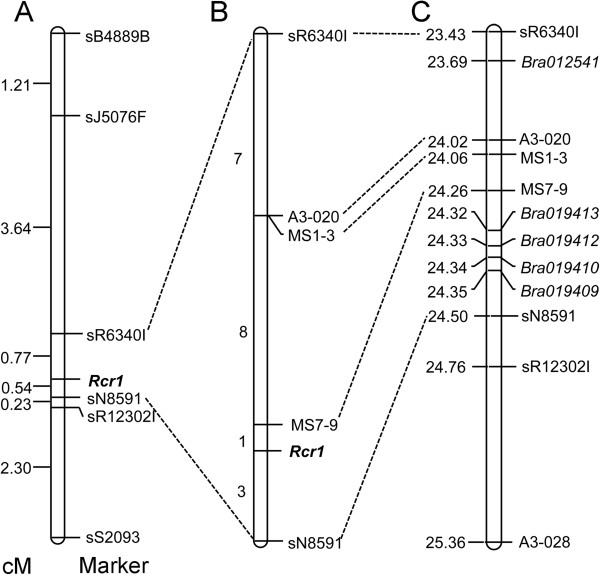
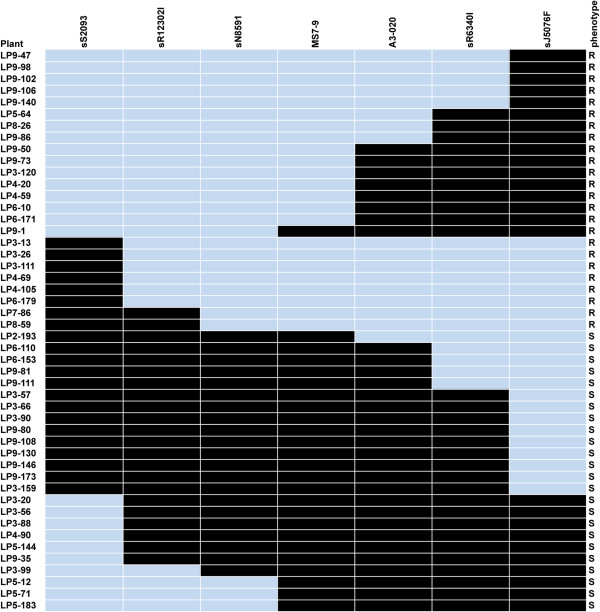
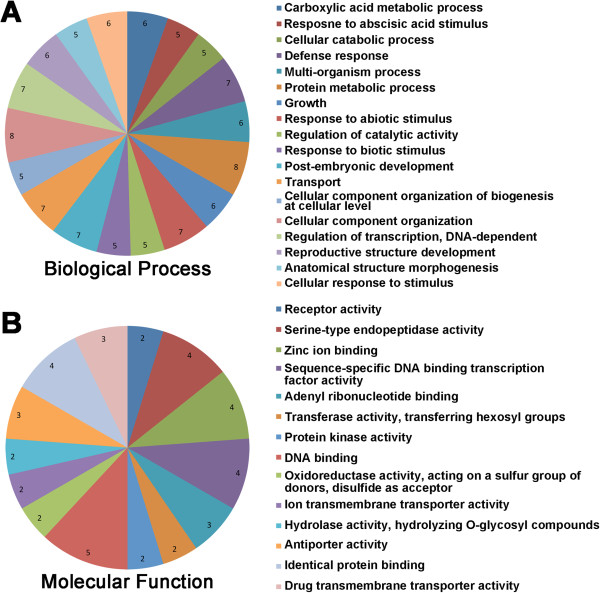
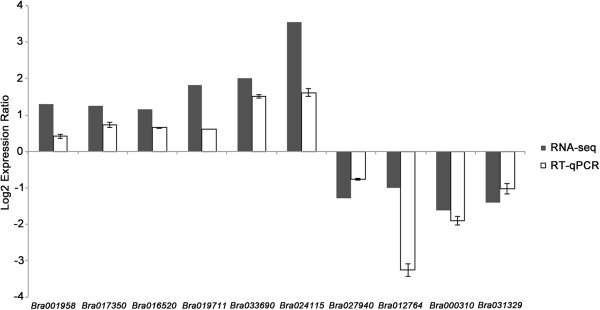
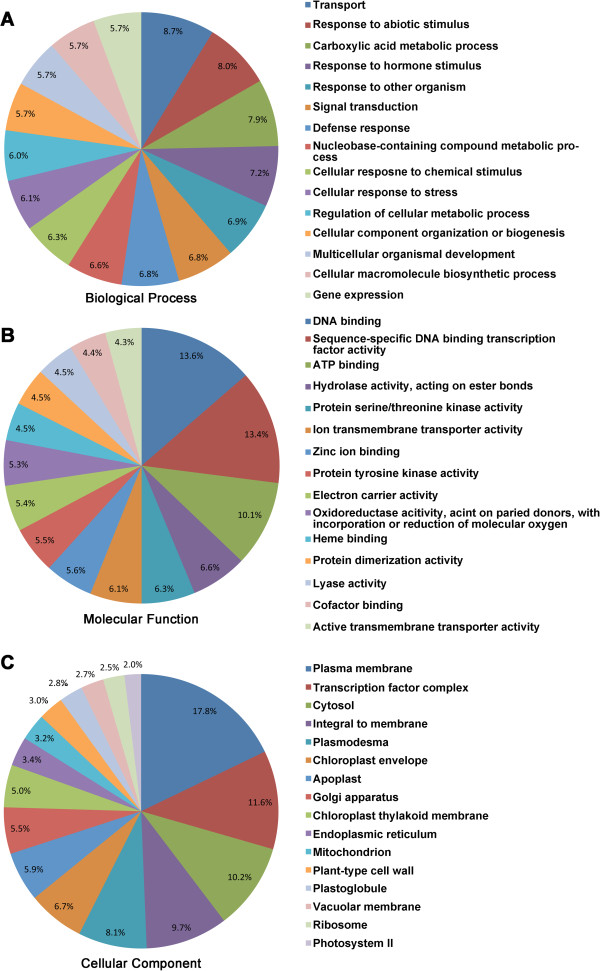
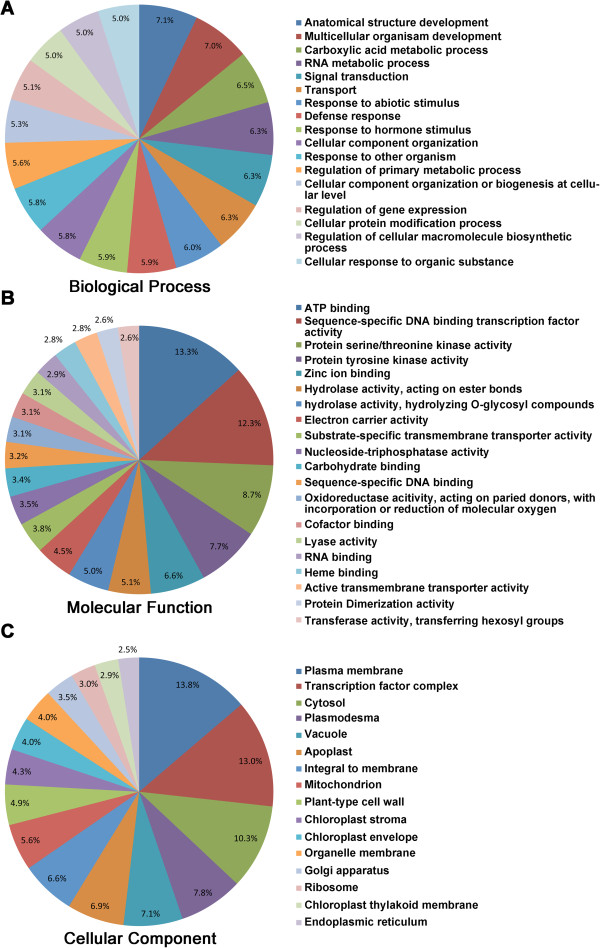
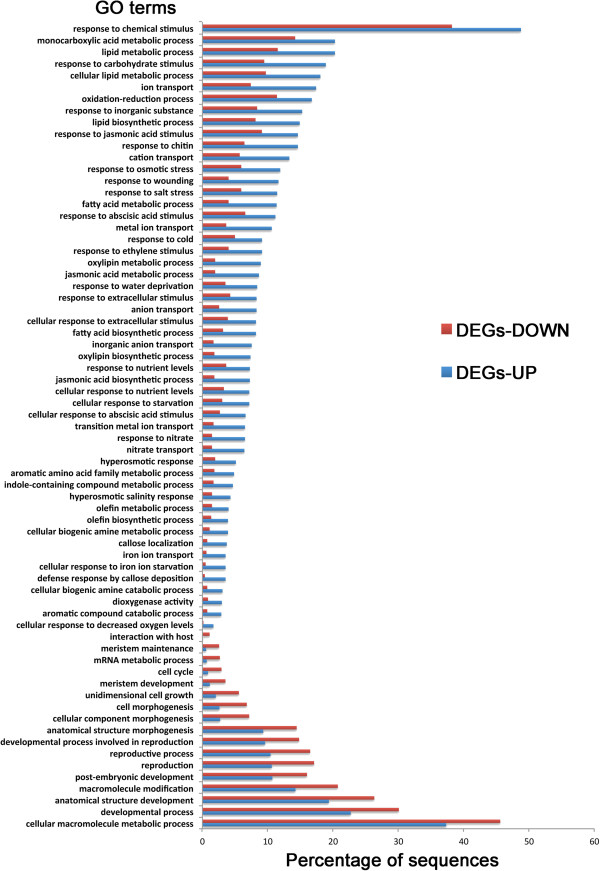
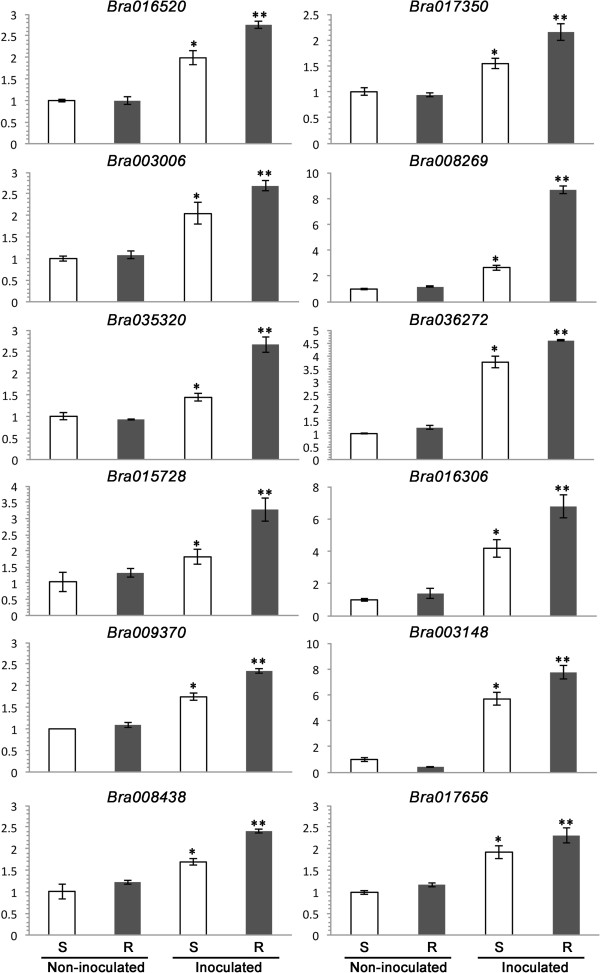
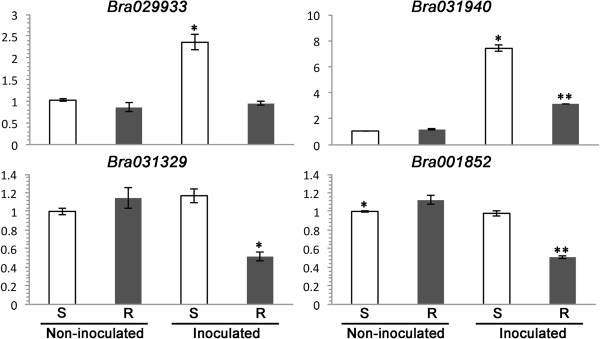
Results: To identify new sources of clubroot resistance (CR), we fine mapped a CR gene (Rcr1) from B. rapa ssp. chinensis to the region between 24.26 Mb and 24.50 Mb on the linkage group A03, with several closely linked markers identified. Transcriptome analysis was conducted using RNA sequencing on a segregating F1 population inoculated with P. brassicae, with 2,212 differentially expressed genes (DEGs) identified between plants carrying and not carrying Rcr1. Functional annotation of these DEGs showed that several defense-related biological processes, including signaling and metabolism of jasmonate and ethylene, defensive deposition of callose and biosynthesis of indole-containing compounds, were up-regulated significantly in plants carrying Rcr1 while genes involved in salicylic acid metabolic and signaling pathways were generally not elevated. Several DEGs involved in metabolism potentially related to clubroot symptom development, including auxin biosynthesis and cell growth/development, showed significantly lower expression in plants carrying Rcr1.

Conclusion: The CR gene Rcr1 and closely linked markers will be highly useful for breeding new resistant canola cultivars. The identification of DEGs between inoculated plants carrying and not carrying Rcr1 is an important step towards understanding of specific metabolic/signaling pathways in clubroot resistance mediated by Rcr1. This information may help judicious use of CR genes with complementary resistance mechanisms for durable clubroot resistance.


Figures

Figure 1
Figure 1
Segregation in clubroot resistance for parents (FN and ACDC) and F 1 populations derived from reciprocal crosses (FN × ACDC and ACDC × FN, respectively). These F1 plants were not part of the F1 population (1,587 plants) used later for fine mapping of CR genes.
Figure 2
Figure 2
Linkage maps of the regions in which the Rcr1 gene is located. Broken lines drawn regions defined by different molecular markers on B. rapa linkage group A03. A) Rough mapping of Rcr1 based on a small F1 population (300 plants) derived from ACDC × FN. The genetic distance is shown on the left. B) Fine mapping of Rcr1 based on 1,587 F1 plants. C) Physical locations in Mb (left) of the molecular markers and TIR-NBS-LRR genes in the region flanked by the markers sN8591 and sR6340I.
Figure 3
Figure 3
Genotypes and phenotypes of recombinants selected from the mapping population inoculated with pathotype 3 of Plasmodiophora brassicae . Line identifications and phenotypes (R for resistant, S for susceptible) are denoted on the left and right, respectively, with marker names at the top. Resistance alleles are denoted in light grey and susceptible alleles in black. The two markers in a grey shadow flank the narrowest interval containing the Rcr1 gene.
Figure 4
Figure 4
Gene ontology (GO) annotations of genes residing in the region flanked by the markers sN8591 and sR6340I in fine mapping: GO terms in the category of A) Biological Process and B) Molecular Functions. The value labeled in the pie chart of both A) and B) are the number of genes annotated with the corresponding GO term.
Figure 5
Figure 5
Validation of RPKM-calculated expression ratios for selected differentially expressed genes (DEGs) using RT-qPCR. RPKM values from RNA-seq are denoted in black, and RT-qPCR results in while. Capped lines represent the standard deviations from three biological replicates.
Figure 6
Figure 6
GO terms associated with upregulated DEGs. A) GO terms in the Biological Process category. B) GO terms in the Molecular Functions. C) GO terms in Cellular Components. The values labeled in the pie charts of panel A, B and C are the percentage of DEGs annotated with the corresponding GO term relative to the total DEGs.
Figure 7
Figure 7
GO terms associated with down-regulated DEGs. A) GO terms in the Biological Process category. B) GO terms in Molecular Functions. C) GO terms in Cellular Component. The values labeled in the pie charts of panel A, B and C are the percentage of DEGs annotated with the corresponding GO term relative to the total DEGs.
Figure 8
Figure 8
Comparison of GO annotations (in Biological Process) of up- and down-regulated DEGs. Blue bars represent the upregulated DEGs while red bars represent down-regulated DEGs. The values were the percentage of DEGs annotated with the corresponding GO terms relative to the total up- or down-regulated DEGs. Statistics of enrichment analysis are presented in the Additional file 1: Table S5.
Figure 9
Figure 9
The relative transcription quantity (RTQ) measured with RT-qPCR for selected upregulated DEGs identified in RNA-seq. The treatments were S-susceptible (without Rcr1) and R-resistant (with Rcr1) plants inoculated with Plasmodiophora brassicae or water (non-inoculated). The vertical axis represents RTQ against an endogenous control (the actin gene Bra037560). Treatments with one asterisk showed significantly higher RTQ (LDS, P < 0.05) than those without asterisk, but lower RTQ than those with two asterisks.
Figure 10
Figure 10
The relative transcription quantity (RTQ) measured with RT-qPCR for selected down-regulated DEGs identified in RNA-seq. The treatments were S-susceptible (without Rcr1) and R-resistant (with Rcr1) plants inoculated with Plasmodiophora brassicae or water (non-inoculated). The vertical axis represents RTQ against an endogenous control (the actin gene Bra037560). Treatments with one asterisk had a significantly different level of RTQ (LDS, P < 0.05) relative to without asterisk or with two asterisks.

References

    1. Dixon GR. The occurrence and economic impact of Plasmodiophora brassicae and clubroot disease. J Plant Growth Regul. 2009;28(3):194–202. doi: 10.1007/s00344-009-9090-y. - DOI
    1. Hwang SF, Strelkov SE, Feng J, Gossen BD, Howard RJ. Plasmodiophora brassicae: A review of an emerging pathogen of the Canadian canola (Brassica napus) crop. Mol Plant Pathol. 2012;13(2):105–113. doi: 10.1111/j.1364-3703.2011.00729.x. - DOI - PMC - PubMed
    1. Peng G, Lahlali R, Hwang SF, Pageau D, Hynes RK, McDonald MR, Gossen BD, Strelkov SE. Crop rotation, cultivar resistance, and fungicides/biofungicides for managing clubroot (Plasmodiophora brassicae) on canola. Can J Plant Pathol. 2014;36(Suppl. 1):99–112. doi: 10.1080/07060661.2013.860398. - DOI
    1. Wallenhammar AC. Prevalence of Plasmodiophora brassicae in a spring oilseed rape growing area in central Sweden and factors influencing soil infestation levels. Plant Pathol. 1996;45(4):710–719. doi: 10.1046/j.1365-3059.1996.d01-173.x. - DOI
    1. Tsusihima S, Murakami H, Akimoto T, Katahira M, Kuroyanagi Y, Shishido Y. A practical estimating method of the dose response curve between inoculum density of Plasmodiophora brassicae and the disease severity for long-term IPM strategies. JARQ. 2010;44(4):383–390. doi: 10.6090/jarq.44.383. - DOI

Publication types

MeSH terms

Substances