

Bayesian kernel machine regression for estimating the health effects of multi-pollutant mixtures
- PMID: 25532525
- PMCID: PMC5963470
- DOI: 10.1093/biostatistics/kxu058
Bayesian kernel machine regression for estimating the health effects of multi-pollutant mixtures
Abstract
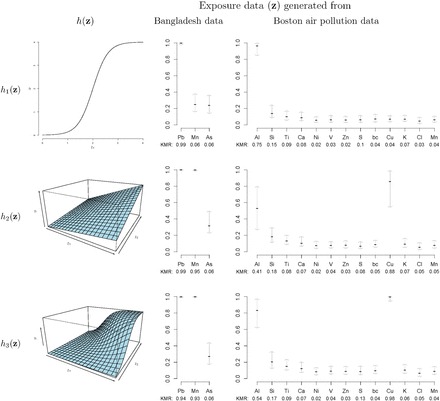
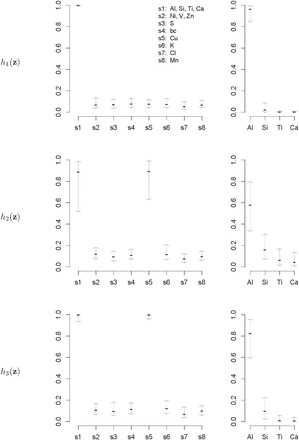
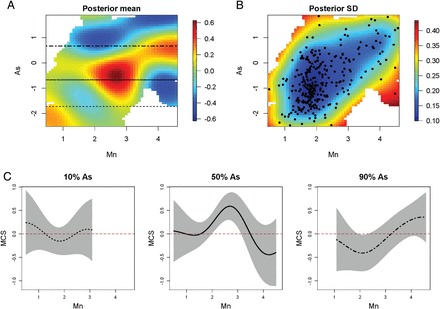
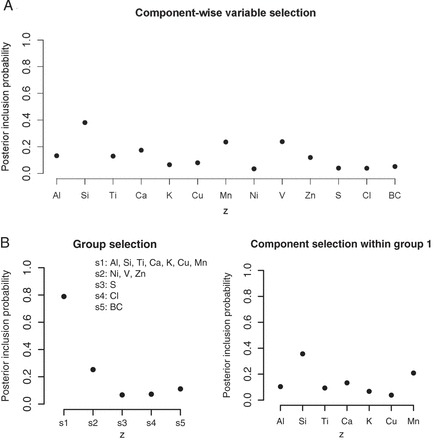
Because humans are invariably exposed to complex chemical mixtures, estimating the health effects of multi-pollutant exposures is of critical concern in environmental epidemiology, and to regulatory agencies such as the U.S. Environmental Protection Agency. However, most health effects studies focus on single agents or consider simple two-way interaction models, in part because we lack the statistical methodology to more realistically capture the complexity of mixed exposures. We introduce Bayesian kernel machine regression (BKMR) as a new approach to study mixtures, in which the health outcome is regressed on a flexible function of the mixture (e.g. air pollution or toxic waste) components that is specified using a kernel function. In high-dimensional settings, a novel hierarchical variable selection approach is incorporated to identify important mixture components and account for the correlated structure of the mixture. Simulation studies demonstrate the success of BKMR in estimating the exposure-response function and in identifying the individual components of the mixture responsible for health effects. We demonstrate the features of the method through epidemiology and toxicology applications.
Keywords: Air pollution; Bayesian variable selection; Environmental health; Gaussian process regression; Metal mixtures.
© The Author 2014. Published by Oxford University Press. All rights reserved. For permissions, please e-mail: journals.permissions@oup.com.
Figures
References
-
- Bailey N. (2005). Bayley Scales of Infant and Toddler Development, Administration Manual, 3rd edition. San Antonio, TX: Harcourt Assessment.
-
- Bartoli C. R., Wellenius G. A., Diaz E. A., Lawrence J., Coull B. A., Akiyama I., Lee L. M., Okabe K., Verrier R. L., Godleski J. J. (2009). Mechanisms of inhaled fine particulate air pollution-induced arterial blood pressure changes. Environmental Health Perspectives 117(3), 361–366. - PMC - PubMed
-
- Billionnet C., Sherrill D., Annesi-Maesano I. (2012). Estimating the health effects of exposure to multi-pollutant mixture. Annals of Epidemiology 22(2), 126–141. - PubMed
-
- Breiman L. (2001). Random forests. Machine Learning 45(1), 5–32.
Publication types
MeSH terms
Substances
Grants and funding
- ES007142/ES/NIEHS NIH HHS/United States
- ES016454/ES/NIEHS NIH HHS/United States
- P30 ES000002/ES/NIEHS NIH HHS/United States
- R01 ES013744/ES/NIEHS NIH HHS/United States
- P30 ES023515/ES/NIEHS NIH HHS/United States
- R01 ES014930/ES/NIEHS NIH HHS/United States
- ES017437/ES/NIEHS NIH HHS/United States
- ES013744/ES/NIEHS NIH HHS/United States
- ES000002/ES/NIEHS NIH HHS/United States
- R01 ES020268/ES/NIEHS NIH HHS/United States
- ES0155/ES/NIEHS NIH HHS/United States
- T32 ES007142/ES/NIEHS NIH HHS/United States
- R01 ES021357/ES/NIEHS NIH HHS/United States
- ES014930/ES/NIEHS NIH HHS/United States
- R00 ES022986/ES/NIEHS NIH HHS/United States
- R21 ES022585/ES/NIEHS NIH HHS/United States
- K23 ES017437/ES/NIEHS NIH HHS/United States
- P42 ES016454/ES/NIEHS NIH HHS/United States
LinkOut - more resources
Full Text Sources
Other Literature Sources
