

Steatogenesis in adult-onset type II citrullinemia is associated with down-regulation of PPARα
- PMID: 25533124
- PMCID: PMC6371055
- DOI: 10.1016/j.bbadis.2014.12.011
Steatogenesis in adult-onset type II citrullinemia is associated with down-regulation of PPARα
Abstract
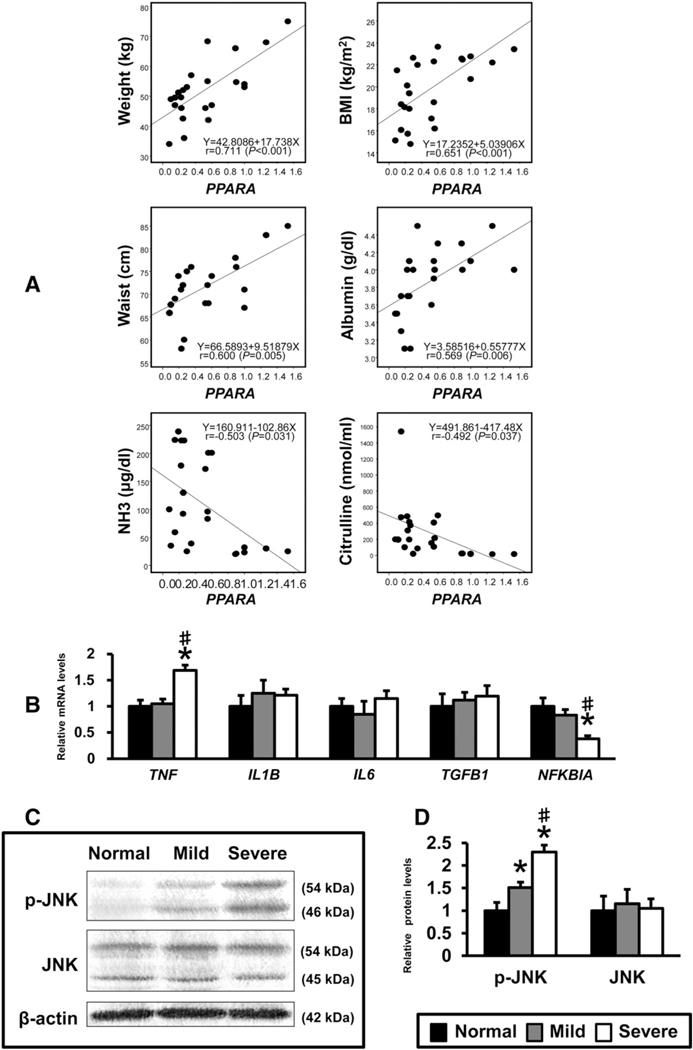
SLC25A13 (citrin or aspartate-glutamate carrier 2) is located in the mitochondrial membrane in the liver and its genetic deficiency causes adult-onset type II citrullinemia (CTLN2). CTLN2 is one of the urea cycle disorders characterized by sudden-onset hyperammonemia due to reduced argininosuccinate synthase activity. This disorder is frequently accompanied with hepatosteatosis in the absence of obesity and ethanol consumption. However, the precise mechanism of steatogenesis remains unclear. The expression of genes associated with fatty acid (FA) and triglyceride (TG) metabolism was examined using liver samples obtained from 16 CTLN2 patients and compared with 7 healthy individuals. Although expression of hepatic genes associated with lipogenesis and TG hydrolysis was not changed, the mRNAs encoding enzymes/proteins involved in FA oxidation (carnitine palmitoyl-CoA transferase 1α, medium- and very-long-chain acyl-CoA dehydrogenases, and acyl-CoA oxidase 1), very-low-density lipoprotein secretion (microsomal TG transfer protein), and FA transport (CD36 and FA-binding protein 1), were markedly suppressed in CTLN2 patients. Serum concentrations of ketone bodies were also decreased in these patients, suggesting reduced mitochondrial β-oxidation activity. Consistent with these findings, the expression of peroxisome proliferator-activated receptor α (PPARα), a master regulator of hepatic lipid metabolism, was significantly down-regulated. Hepatic PPARα expression was inversely correlated with severity of steatosis and circulating ammonia and citrulline levels. Additionally, phosphorylation of c-Jun-N-terminal kinase was enhanced in CTLN2 livers, which was likely associated with lower hepatic PPARα. Collectively, down-regulation of PPARα is associated with steatogenesis in CTLN2 patients. These findings provide a novel link between urea cycle disorder, lipid metabolism, and PPARα.
Keywords: JNK; Mitochondrial β-oxidation; NAFLD; PPARα; SLC25A13; Urea cycle disorder.
Copyright © 2014 Elsevier B.V. All rights reserved.
Conflict of interest statement
Conflict of interest
The authors have declared that no conflict of interest exists.
Figures


References
-
- Badizadegan K Perez-Atayde AR Focal glycogenosis of the liver in disorders of ureagenesis: its occurrence and diagnostic significance Hepatology 26 (1997) 365–373. - PubMed
-
- Tomomura M Imamura Y Horiuchi M Koizumi T Nikaido H Hayakawa J Saheki T Abnormal expression of urea cycle enzyme genes in juvenile visceral steatosis (jvs) mice Biochim. Biophys. Acta 1138 (1992) 167–171. - PubMed
-
- Begum L Jalil MA Kobayashi K Iijima M X Li M Yasuda T Horiuchi M del Arco A Satrustegui J Saheki T Expression of three mitochondrial solute carriers, citrin, aralar1 and ornithine transporter, in relation to urea cycle in mice Biochim. Biophys. Acta 1574 (2002) 283–292. - PubMed
-
- Saheki T Kobayashi K Iijima M Nishi I Yasuda T Yamaguchi N Gao HZ A Jalil M Begum L Li MX Pathogenesis and pathophysiology of citrin (a mitochondrial aspartate glutamate carrier) deficiency Metab. Brain Dis. 17 (2002) 335–346. - PubMed
MeSH terms
Substances
Supplementary concepts
Grants and funding
LinkOut - more resources
Full Text Sources
Other Literature Sources
Medical
Research Materials
Miscellaneous
