. 2016 Feb;71(2):170-7.
doi: 10.1093/gerona/glu223. Epub 2014 Dec 22.

Accessing Data Resources in the Mouse Phenome Database for Genetic Analysis of Murine Life Span and Health Span

Affiliations

Accessing Data Resources in the Mouse Phenome Database for Genetic Analysis of Murine Life Span and Health Span

Molly A Bogue et al. J Gerontol A Biol Sci Med Sci. 2016 Feb.

Abstract

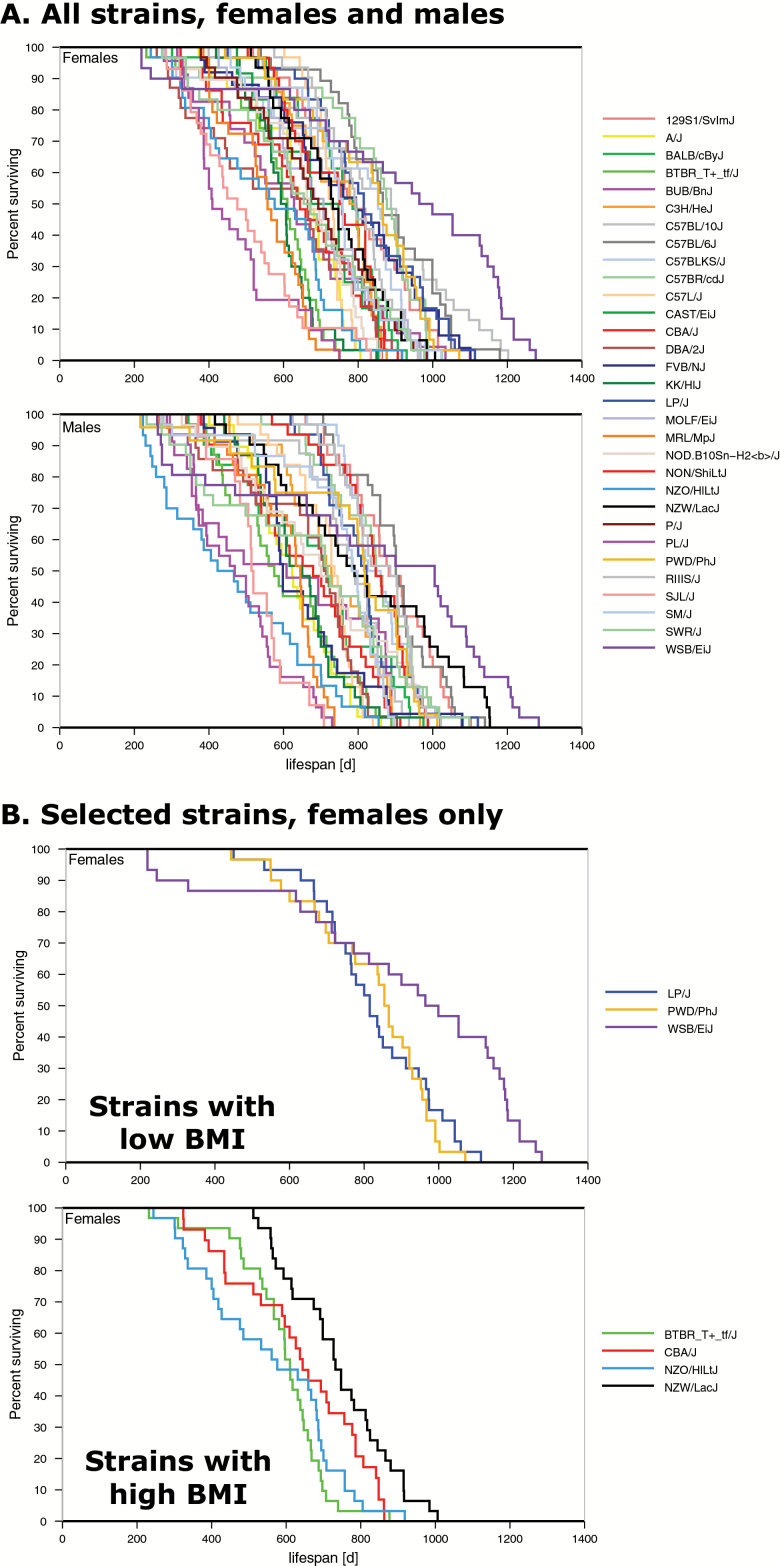
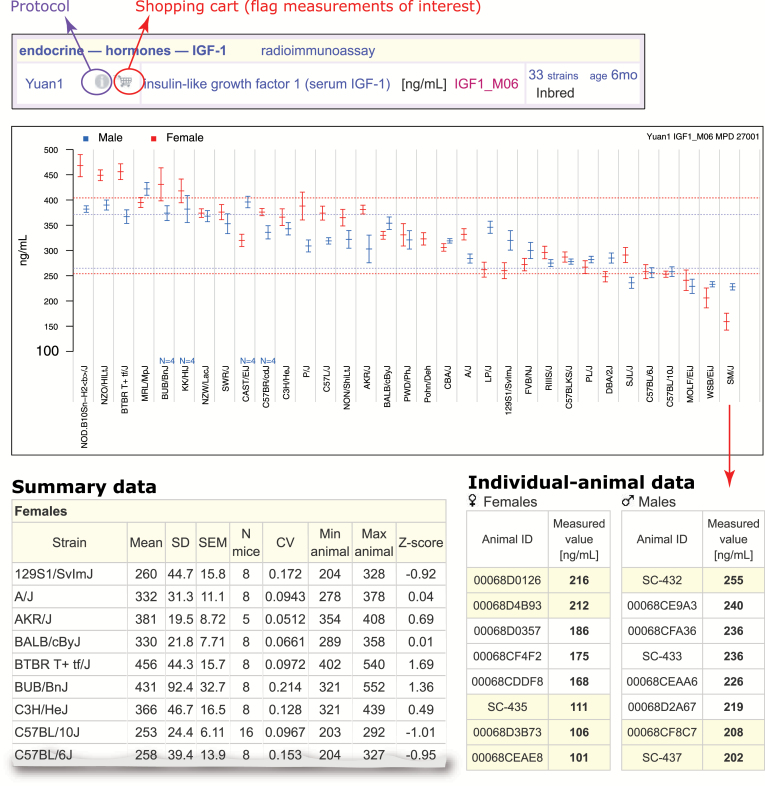
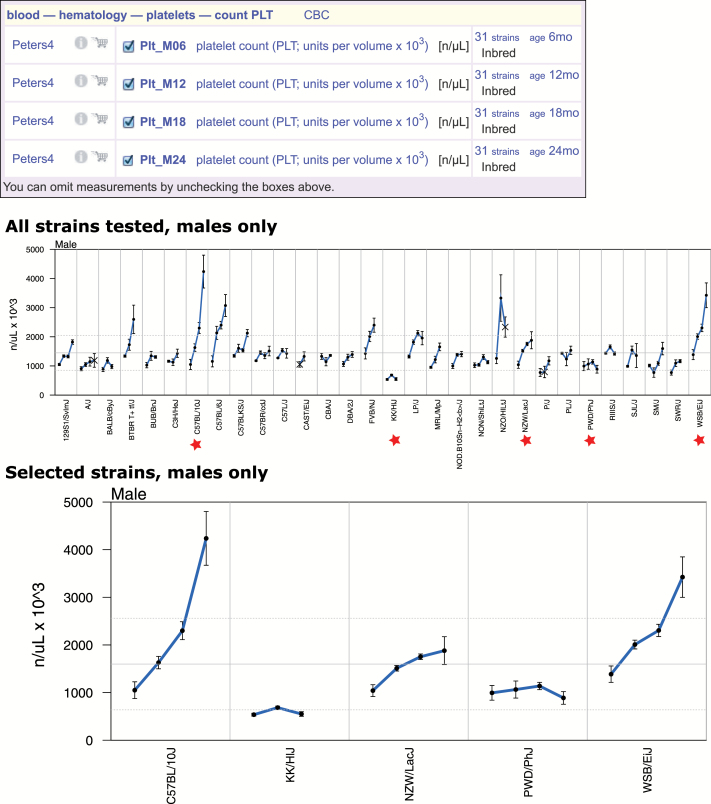
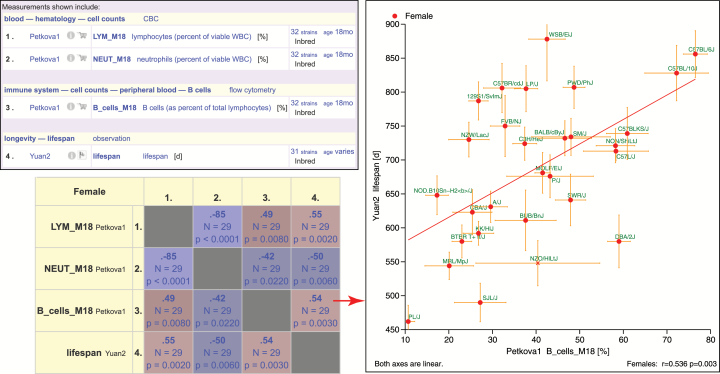
Understanding the source of genetic variation in aging and using this variation to define the molecular mechanisms of healthy aging require deep and broad quantification of a host of physiological, morphological, and behavioral endpoints. The murine model is a powerful system in which to understand the relations across age-related phenotypes and to identify research models with variation in life span and health span. The Jackson Laboratory Nathan Shock Center of Excellence in the Basic Biology of Aging has performed broad characterization of aging in genetically diverse laboratory mice and has placed these data, along with data from several other major aging initiatives, into the interactive Mouse Phenome Database. The data may be accessed and analyzed by researchers interested in finding mouse models for specific aging processes, age-related health and disease states, and for genetic analysis of aging variation and trait covariation. We expect that by placing these data in the hands of the aging community that there will be (a) accelerated genetic analyses of aging processes, (b) discovery of genetic loci regulating life span, (c) identification of compelling correlations between life span and susceptibility for age-related disorders, and (d) discovery of concordant genomic loci influencing life span and aging phenotypes between mouse and humans.

Keywords: Database; Functional genomics; Mouse; Phenotype.


Figures

Figure 1.
Figure 1.
Survival curves for 31 inbred strains of mice. (A) All strains tested, both sexes. Percent survival is shown on the y-axis and life span on the x-axis in days. (B) Selected strains, females only, are shown as an example to illustrate the selection of strains of interest for plotting survival curves in Mouse Phenome Database. In this example, we chose strains with low body mass index (BMI) versus high BMI at 12 mo of age (see Survival Curves section), plotted them separately and downloaded each. We show them here in the same figure for comparison purposes. Strains are color-coded; some colors were altered for clarity. Survival data are from Yuan2; BMI data were accessed through the Ackert1 study (data not shown). To generate these figures: (A) From the homepage, select “Phenotype,” select “Longevity.” From the Yuan2 study select “Survival curve comparison,” and use the pulldown menu to select strain set = “all strains,” click on “Go.” (B) From landing page for (A), hit the back button, select strains where females at 12 mo of age are low for BMI (view this measurement in a new window through a search on “BMI”), generate the Kaplan–Meier plot by clicking on “Go”; repeat this process by selecting strains that are high for BMI. “eps” was selected as the “Result type”; images were downloaded for publication-quality figures.
Figure 2.
Figure 2.
Measurement plot and underlying data for IGF-1. The upper panel (Mouse Phenome Database screenshot) identifies the measurement and its attributes (project (Yuan1), methodology used (radioimmunoassay), variable name (in magenta), number of strains tested (33), strain type (inbred) and age (6 mo). The “i” (info) icon (circled in purple) to the right of “Yuan1” takes users to a detailed protocol. The “shopping cart” icon (circled in red) allows users to select (flag) this measurement for use in more advanced analyses (described in Figs. 4, 5). The middle panel shows the plot with strains along the x-axis and IGF-1 levels on the y-axis, males in blue, females in red. The dotted lines indicate ±1 SD of the overall means across all strains for males and females, separately. Each strain mean is shown with 1 SEM. Low sample sizes are noted on the plot above strain name. The lower left panel shows summary data (for females only) in tabular format (mean, SD, SEM, number of mice tested (N), coefficient of variation (CV), min–max range, and Z-score). The lower right panel shows the individual animal data when clicking on the SM/J region of the plot (arrow). To generate this figure: From the homepage, search on “IGF,” from results page click on “List these traits/measurements,” click on “insulin-like growth factor 1 (serum IGF-1),” age 6 mo for the Yuan1 project. The plot shown in this figure will be near the top of the page; scroll down for summary data (click on “Magnitude order/details” to get the detailed view shown in this figure); click on the original plot directly or click on the strain mean links in the original summary table for your strain of interest to generate individual animal data (shown). “eps” was selected as the “Result type” after selecting “Detail options” just above the plot; image was downloaded for publication-quality figure.
Figure 3.
Figure 3.
Strain comparison for platelet count across multiple ages. The top panel identifies the measurements that are plotted (see Fig. 2 legend for more information about measurements and their attributes). The middle panel shows the profiles for males of all strains tested for ages 6, 12, 18, and 24 mo. Error bars are standard error of the mean. Various detail options are available, including adjusting the color of the data points, changing the size of the data points, choosing the color and thickness of error bars, highlighting strains, omitting strains, or showing selected strains only. The lower panel shows a more detailed plot of five strains we selected (red stars). Data are from the Peters4 study. To generate these figures: From the homepage, “Phenotype,” then select “Blood—hematology,” then “platelets,” scroll down to Peters4, click on “age comparison” to arrive at the middle panel, scroll down further for plotting options and the ability to select specific strains. “eps” was selected as the “Result type”; image was downloaded for publication-quality figure.
Figure 4.
Figure 4.
Correlations matrix and scatterplot of selected peripheral blood leukocytes and life span. The top right panel identifies measurements of interest (see Fig. 2 legend for more information about measurements and their attributes). This matrix was generated from various flagged measurements (shopping cart, see Fig. 2, circled in red). The lower left panel shows the correlation matrix for females with Pearson correlation coefficient, sample size (N), and p value for each pair-wise result (individual cells of the matrix). Red color values are for positive correlations, blue for negative. The more intense colors indicate higher coefficients. The right panel shows a detailed scatterplot resulting from clicking on the associated cell of the matrix (arrow). Life span is on the y-axis, B cell percentage (18 mo) is on the x-axis. PBL data are from Petkova1 and life span data are from Yuan2. To generate this figure: The shopping cart feature must be used to flag measurements of interest across multiple projects. In this example, measurements are selected from Yuan2 and Petkova1. Search on “Yuan2,” click on the project, then click on the shopping cart (example circled in Fig. 2) for life span data (a pop-up window indicates that a measurement has been added to the collection). Then go to the Petkova1 project by searching on “Petkova1.” Click on “Apply tools” to the left of the listing of measurements. Select (check boxes) Petkova1 measurements shown in the screenshot at the top of this figure. Then scroll all the way down to see measurements in the collection (shopping cart). Select “life span” from the Yuan2 project. Then click on “Next” near the top of the page to go to the Mouse Phenome Database toolbox. Click on “Pheno correlations matrix” near the middle of the page. To generate the scatterplot, click on the indicated cell then scroll down and select “females.” “eps” was selected as the “Result type”; image was downloaded for publication-quality figure.
Figure 5.
Figure 5.
Find mouse models that meet your criteria. (A) For this example, we wanted to identify strains that have an average percentage of B cells at 18 mo, but that have relatively long or short life spans. This result was generated from measurements previously flagged (shopping cart, see Figure 2). The chosen measurements for this example are shown near the top. A user must select the desired “level”’ for each measurement based on Z-score: high, mid, low, or simply show. In this case, we want to see a “mid” range for B cells and “show” life span so that we can identify strains with long versus short life spans. Blue highlighting indicates low-end outlier strains, yellow indicates high-end outliers. Results are truncated and shown as a screenshot. B cell data are from Petkova1, life span data are from Yuan2. (B) For this more complicated example, we wanted to identify mouse strains with multiple phenotypes relevant to health span so that we can make an informed decision for choosing optimal strains to test compounds that might extend life span. We used the same tool illustrated in Fig 5A, but present the results of the analysis more compactly in Excel for ease of viewing. All mice were 18–20 mo of age. Phenotypes accessed and criteria imposed: high alanine aminotransferase (ALT) (Yuan3), low thyroxine (T4) (Yuan3), low B cell percentage (Petkova1), high neutrophil percentage (Petkova1), high albumin:creatinine ratio (Korstanje1), low gait score (Xing2), low BMI (Ackert1), and short life span (Yuan2). High and low-end outliers are greater than ±2.0 SD from the mean while borderline outliers are greater than ±1.25 SD. To generate these figures: (A) Select measurements across projects as detailed in Fig. 4 legend. Select measurements shown in this figure and click on “Next.” In the toolbox, select “Find strains that best fit your criteria.” From the pulldown menus select indicated levels for each measurement. For output, adjust the pulldown menus to: “all, alphabetical,” “females,” “outliers colored.” Click on “Go.” Scroll all the way down next to the color key at the bottom of the page to see the strains in this example. (B) Add indicated measurements across projects (listed above) to the shopping cart as detailed in Fig. 4 legend. Follow directions above for (A). Summarize results of selected strains in Excel by color-coding.

Similar articles

  • Mouse phenome database.
    Grubb SC, Maddatu TP, Bult CJ, Bogue MA. Grubb SC, et al. Nucleic Acids Res. 2009 Jan;37(Database issue):D720-30. doi: 10.1093/nar/gkn778. Epub 2008 Nov 5. Nucleic Acids Res. 2009. PMID: 18987003 Free PMC article.
  • Quantitative trait loci affecting natural variation in Drosophila longevity.
    Geiger-Thornsberry GL, Mackay TF. Geiger-Thornsberry GL, et al. Mech Ageing Dev. 2004 Mar;125(3):179-89. doi: 10.1016/j.mad.2003.12.008. Mech Ageing Dev. 2004. PMID: 15013662
  • Mouse Phenome Database (MPD).
    Bogue MA, Grubb SC, Maddatu TP, Bult CJ. Bogue MA, et al. Nucleic Acids Res. 2007 Jan;35(Database issue):D643-9. doi: 10.1093/nar/gkl1049. Epub 2006 Dec 6. Nucleic Acids Res. 2007. PMID: 17151079 Free PMC article.
  • Selection for maximum longevity in mice.
    Harrison DE, Roderick TH. Harrison DE, et al. Exp Gerontol. 1997 Jan-Apr;32(1-2):65-78. doi: 10.1016/s0531-5565(96)00034-4. Exp Gerontol. 1997. PMID: 9088903 Review.
  • Murine models of life span extension.
    Quarrie JK, Riabowol KT. Quarrie JK, et al. Sci Aging Knowledge Environ. 2004 Aug 4;2004(31):re5. doi: 10.1126/sageke.2004.31.re5. Sci Aging Knowledge Environ. 2004. PMID: 15295107 Review.

Cited by

References

    1. Brown SD, Moore MW. The International Mouse Phenotyping Consortium: past and future perspectives on mouse phenotyping. Mamm Genome. 2012;23:632–640. doi:10.1007/s00335-012-9427-x - PMC - PubMed
    1. Ringwald M, Iyer V, Mason JC, et al. The IKMC web portal: a central point of entry to data and resources from the International Knockout Mouse Consortium. Nucleic Acids Res. 2011;39(Database issue):D849–D855. doi:10.1093/nar/gkq879 - PMC - PubMed
    1. Churchill GA, Airey DC, Allayee H, et al. The Collaborative Cross, a community resource for the genetic analysis of complex traits. Nat Genet. 2004;36:1133–1137. doi:10.1038/ng1104-1133 - PubMed
    1. Chesler EJ, Miller DR, Branstetter LR, et al. The Collaborative Cross at Oak Ridge National Laboratory: developing a powerful resource for systems genetics. Mamm Genome. 2008;19:382–389. doi:10.1007/s00335-008-9135-8 - PMC - PubMed
    1. Churchill GA, Gatti DM, Munger SC, Svenson KL. The Diversity Outbred mouse population. Mamm Genome. 2012;23:713–718. doi:10.1007/s00335-012-9414-2 - PMC - PubMed

Publication types